STUDY #02 · 2026 · IN OBSERVATION
Gray-Scott Reaction-Diffusion
A model-driven visual study of morphogenesis and self-replication.
WHAT IS THIS
Gray-Scott is an idealised model of autocatalysis — a reaction whose product speeds up its own creation. Where the BZ reaction oscillates in time, Gray-Scott grows in space: a single seed divides, branches, and fills the field, then holds. It is a clean instance of a Turing instability, where diffusion — usually a smoothing force — instead breaks symmetry and lets spots, worms, and coral-like labyrinths stand.
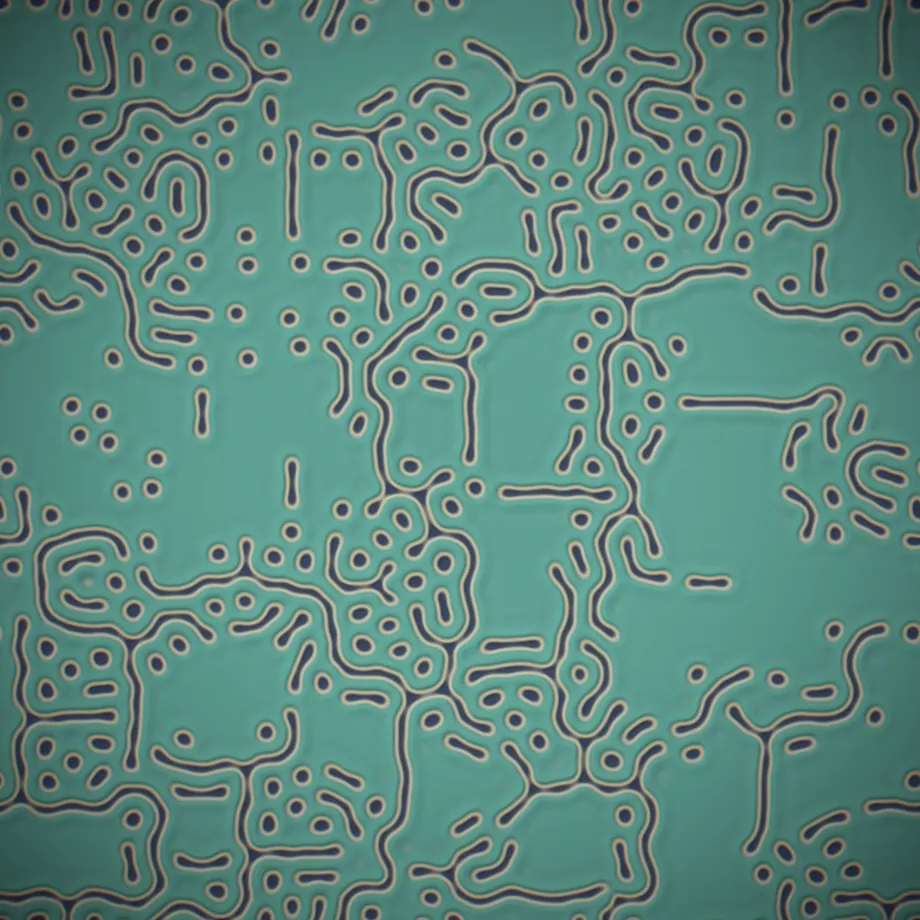
This study runs the two-variable Gray-Scott system on the GPU and films a single growth arc: one seed, self-replicating outward into a radial coral colony. Nothing is placed by hand — the whole morphology is set by two rates, feed and kill.
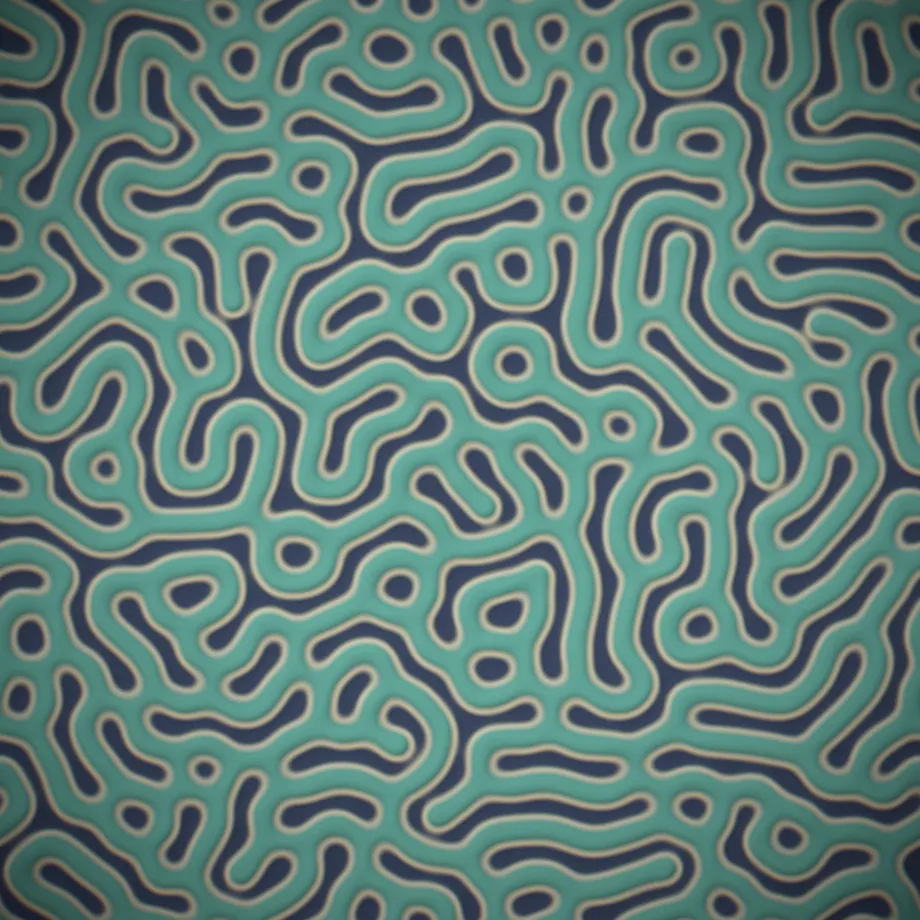
This is not a scientific simulation result, but a visual interpretation of the phenomenon.
PARAMETERS EXPLORED
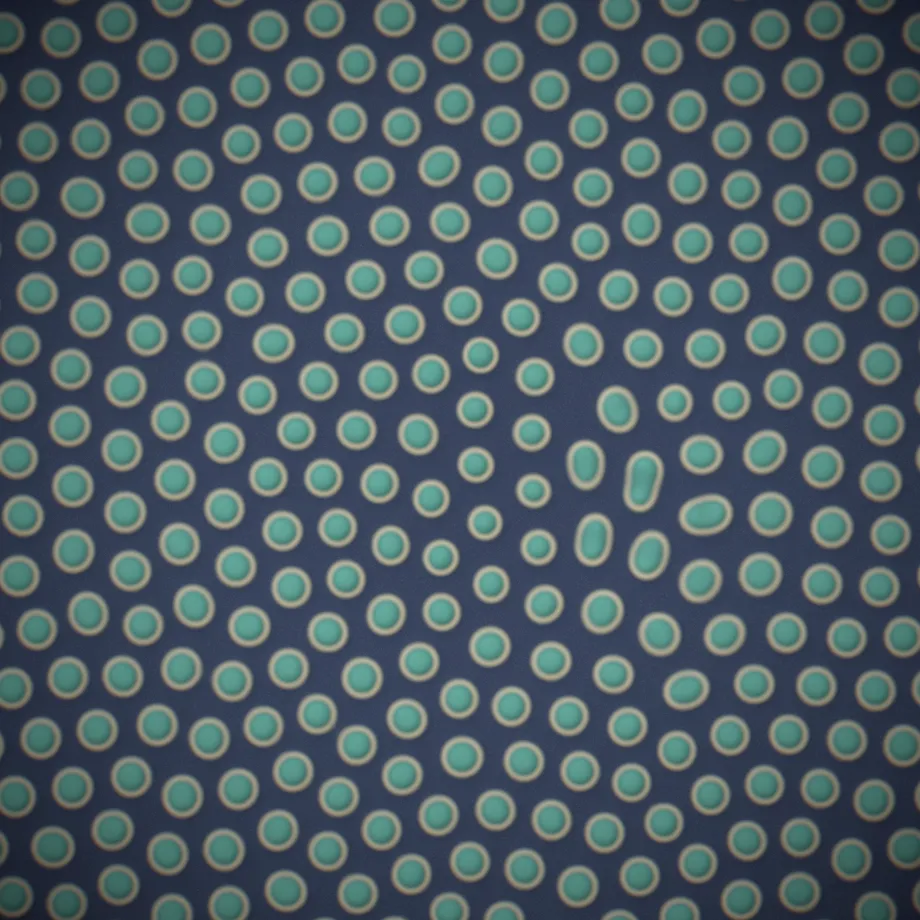
Each image below records its exact parameter set.
THE MATHEMATICS the model behind the images
Two chemicals diffusing at different rates, driven by a cubic autocatalysis U + 2V → 3V — one feed, one kill.
Inspired by the Gray–Scott model. Colour maps v; the front glow maps the reaction rate u·v² — quantities inside the model, not a spectral measurement.
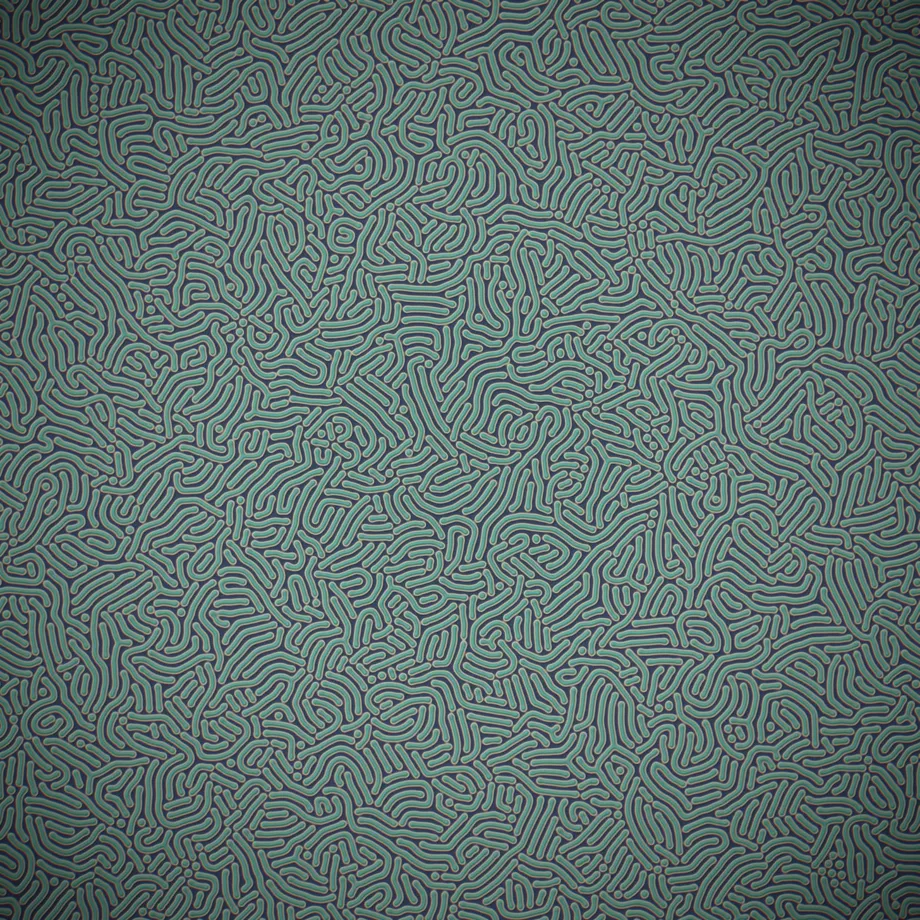
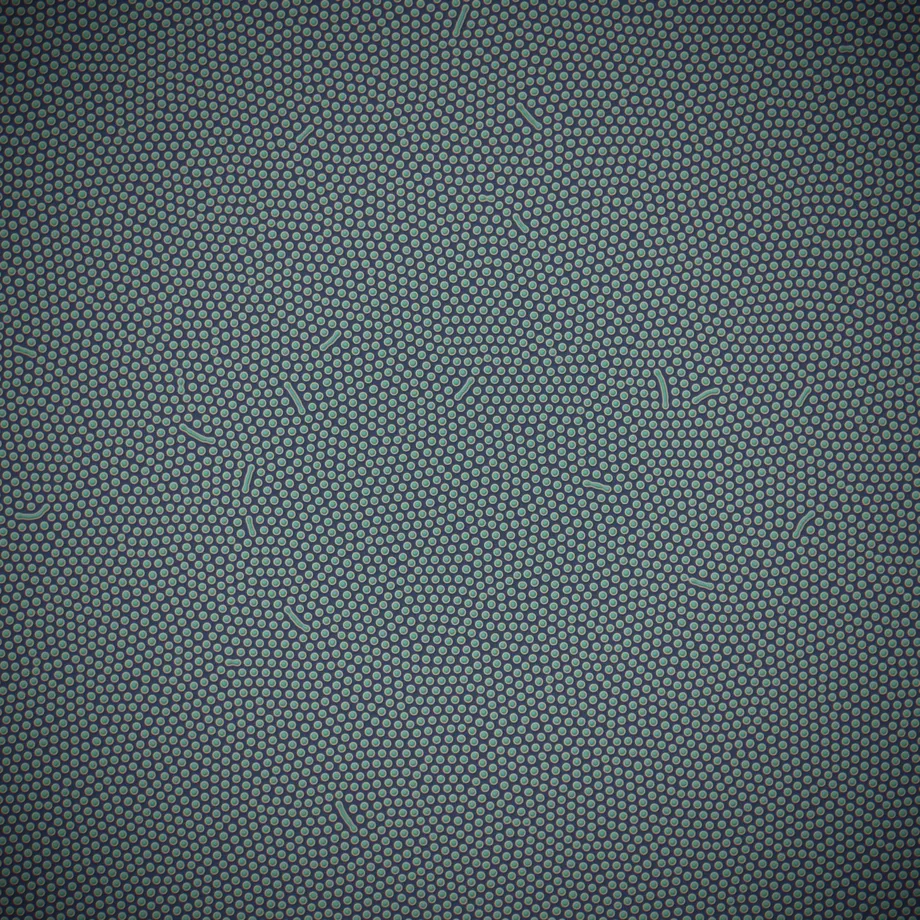
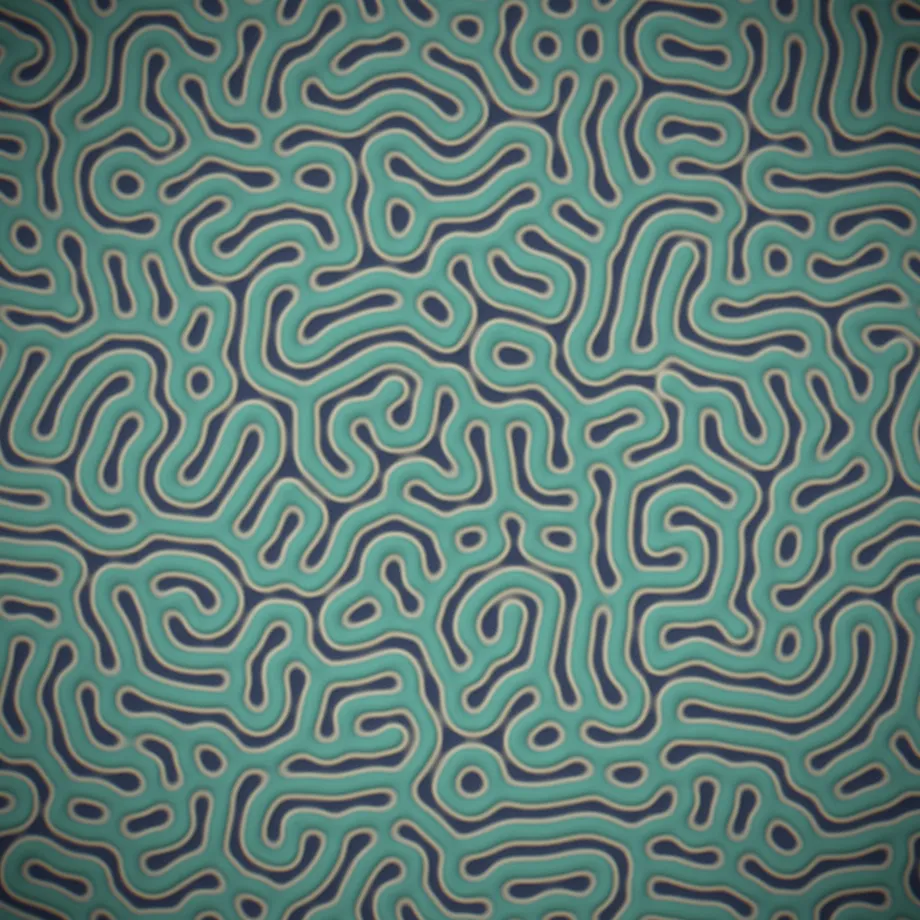
SELECTED STILLS — 6
PROCESS — PARAMETER SWEEPS
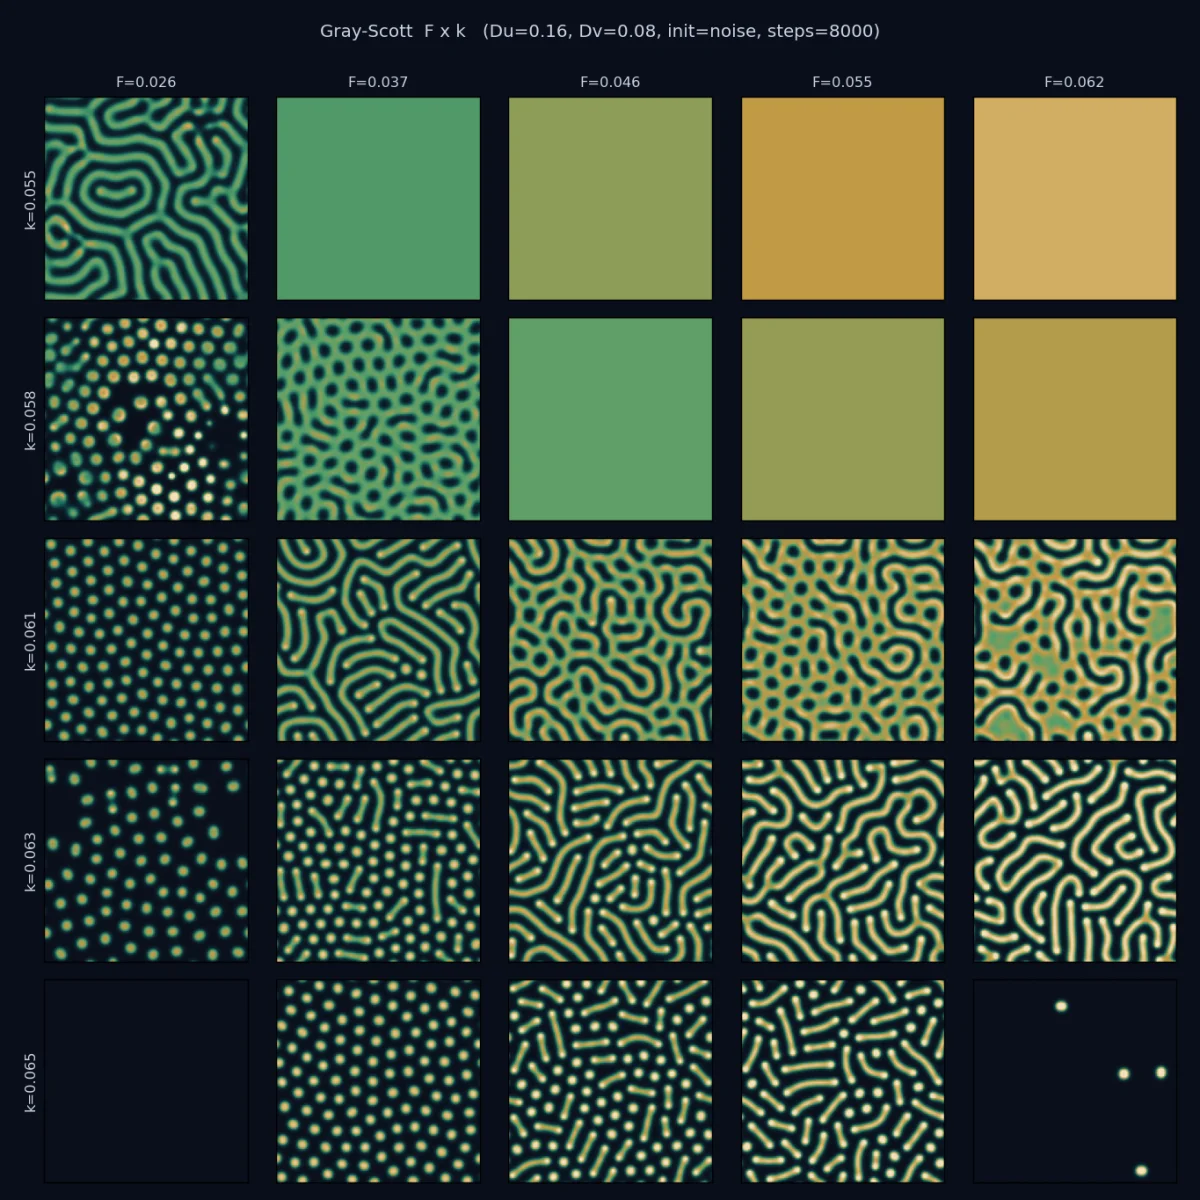
The coral, the dividing spots, the labyrinth — one model, chosen from a sweep of the feed and kill rates across the plane where each pattern lives.
COLOUR / FORM = REAL PHYSICS
The visible pattern is the autocatalyst concentration v; colour is mapped to v, and the glow is mapped to the reaction rate u·v² — the amount of catalyst being created right now.
Because reaction only happens where fresh substrate meets the autocatalyst, only the advancing front lights up. Once a stripe has settled and its substrate is spent, it goes matte. The result reads as living tissue: a warm, luminous growing edge over a cool, quiet body.
The palette — tissue, deep navy body ⇄ amber front — is a house colourway. Gray-Scott is an abstract reactor, not a specific chemistry, so its colour is an interpretation of the fields v and u·v², not a measurement.
Colour = v · glow = reaction rate u·v² — model quantities, not measurements.
REFERENCES
- P. Gray, S. K. Scott. "Autocatalytic reactions in the isothermal, continuous stirred tank reactor: Oscillations and instabilities in the system A + 2B → 3B; B → C." Chemical Engineering Science, vol.39, 1087-1097 (1984).
- J. E. Pearson. "Complex Patterns in a Simple System." Science, vol.261, 189-192 (1993).
- A. M. Turing. "The Chemical Basis of Morphogenesis." Philosophical Transactions of the Royal Society of London B, vol.237, 37-72 (1952).
INTERACTIVE STUDY
A small window into the model behind this study — a deliberately simplified instrument, reduced in resolution, scope, and rendering. The finished works above are something else entirely: parameters swept, frames chosen, and graded by hand from the full engine. Bend the feed and kill rates to switch the morphology, and flip the view between the tissue it forms and the reaction rate — the glowing front where new pattern is being made right now.
This interactive study is not intended as a scientifically validated reproduction. It is a visual interpretation generated from an implemented model and curated parameter exploration — and it is a deliberately simplified instrument, separate from the full engine used to author the finished works.