PHENOMENA STUDIES WEAVER AXIOM
Studies Archive About
← INDEX

STUDY #24  ·  2026 · IN OBSERVATION

Physarum

A model-driven visual study of slime-mould transport networks.

MOVING IMAGE — THE CONDENSATION ARC noise → mesh → pruning · SA 60° · RA 40° · SO 9 · decay 0.12 · 36,864 agents · t 0 → 570 · plasmodium

WHAT IS THIS

Physarum polycephalum is a single-celled slime mould with no brain, yet it lays down efficient tube networks between food sources, finds shortest paths through mazes, and — famously — grows a network resembling a country's rail map. It coordinates through the environment alone: each part leaves a chemical trail and follows the trails the others left, a behaviour called stigmergy. No agent ever sees the network.

This study runs Jones' (2010) multi-agent approximation: 36,864 agents on a shared trail field, each one smelling three points ahead, steering toward the strongest trail, stepping, and depositing a mark; the field diffuses and decays every step. Positive feedback (follow the strong trail) and negative feedback (diffuse and forget) select a network out of noise. It runs in real time on the GPU — and the picture is the trail field itself, not the walkers. The veins outlive the agents that drew them.
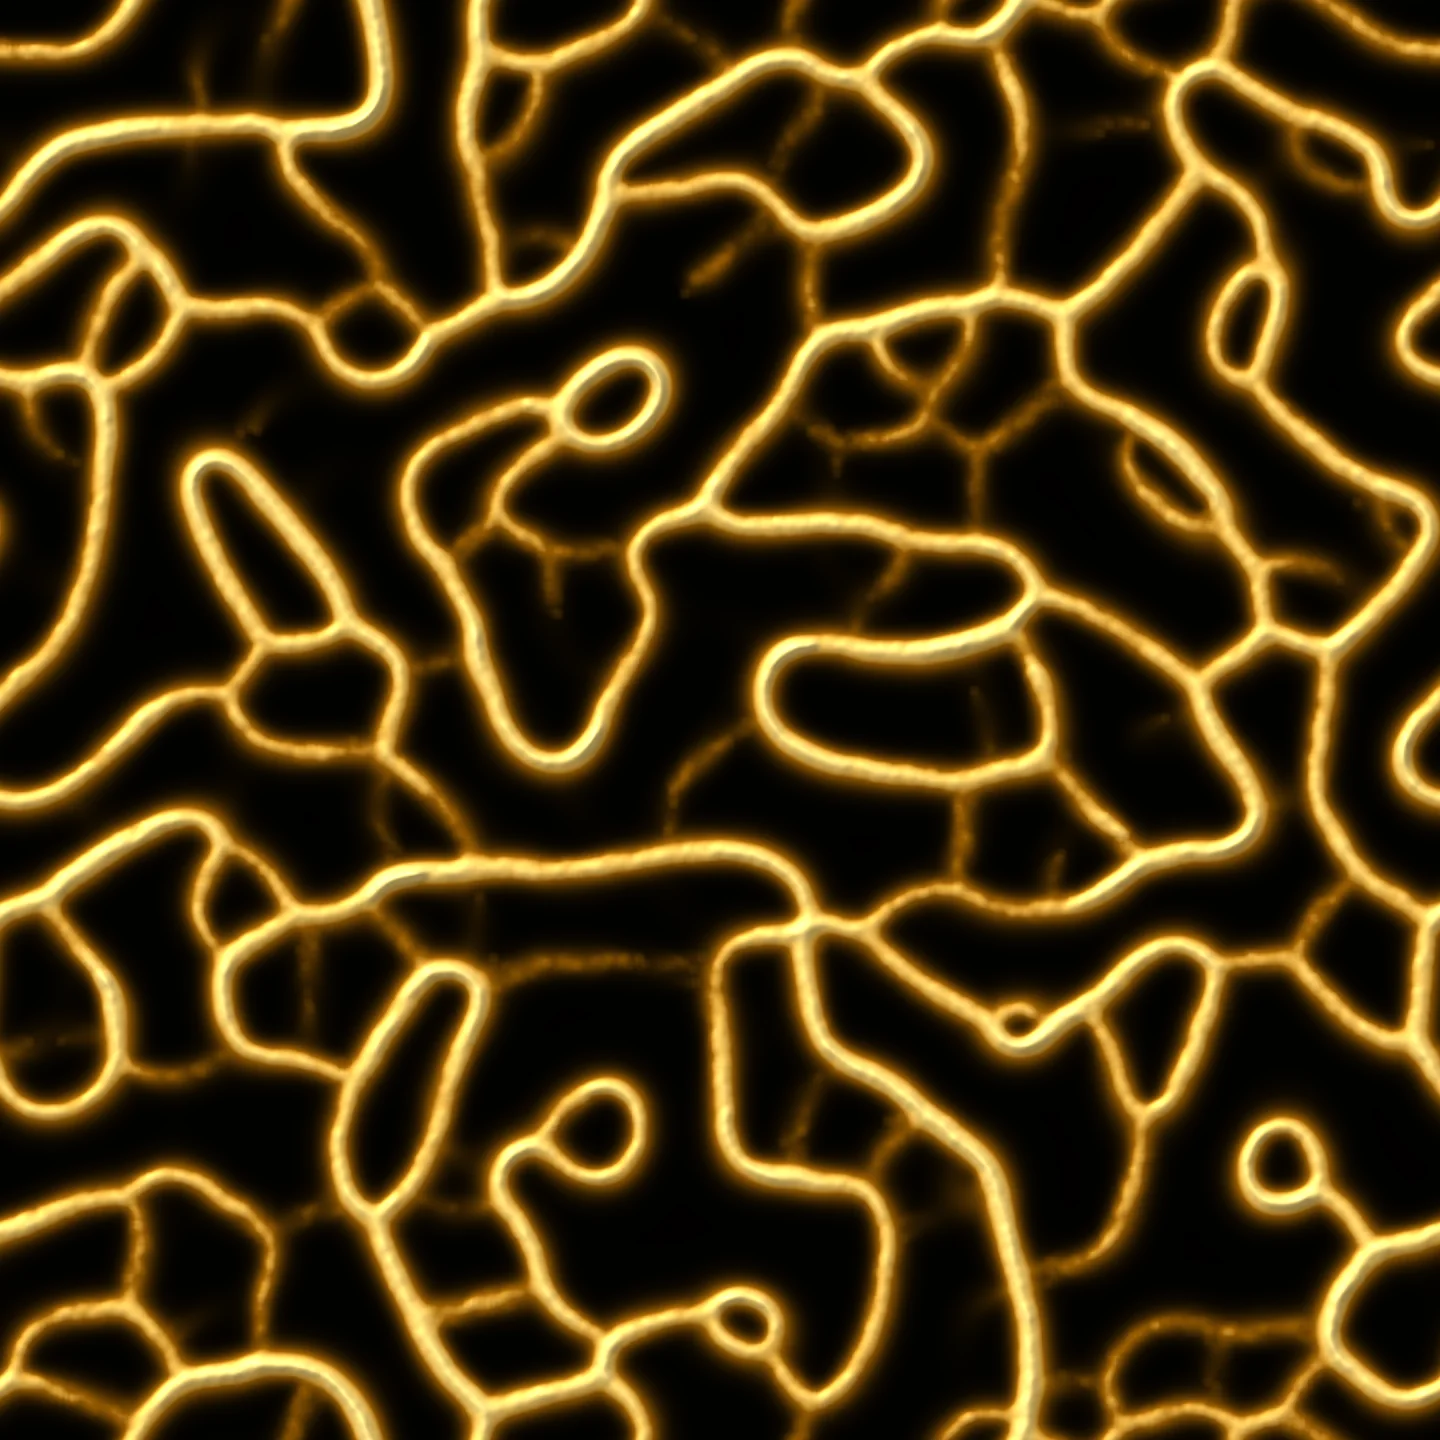
reticular mesh — the hero web of junctions and loops, chrome-yellow on dark agar
reticular mesh — the hero web of junctions and loops, chrome-yellow on dark agar SA 60° · RA 40° · SO 9 · decay 0.12 · 36,864 agents · 512² · t 150 · plasmodium
Motif stigmergy / agent trails / vein networks / self-organized transport
Method A small simulator was generated and modified with AI assistance, then ported to a real-time GPU (GLSL) renderer. The visual output was selected through parameter exploration.
Observation With no food sources and no plan, a network precipitates out of uniform noise: each agent only leaves a trail and follows the trail, yet a reticular web selects itself. The picture is the trail field, not the walkers — the veins outlive the agents that drew them. It optimises by pruning: a fine mesh condenses, then loops are cut and tubes thicken, so the characteristic spacing grows with time. How coarse the mesh is reads the clock — the same optimisation that, with food added, solves mazes.
Reference Jeff Jones, "Characteristics of Pattern Formation and Evolution in Approximations of Physarum Transport Networks," Artificial Life, vol.16, no.2, 127-153 (2010); T. Nakagaki, H. Yamada & Á. Tóth, "Maze-Solving by an Amoeboid Organism," Nature, vol.407, 470 (2000).
Tools Python / NumPy / SciPy / three.js / React / GLSL / ffmpeg / AI coding assistant
Year 2026

This is not a scientific simulation result, but a visual interpretation of the phenomenon.

SAME FAMILY, THE PICTURE INVERTED

Vicsek draws the walkers. Physarum draws what the walkers leave behind.

Study #13 — Vicsek Study #24 — Physarum
What emerges collective motion — velocities align into one flowing flock collective infrastructure — a transport network laid down in the medium
The picture the particles' instantaneous positions — the streaks of a murmuration the trail field the particles write — the veins persist after the walkers move on
Where the memory lives nowhere — turn the noise up and the flock is gone without residue in the medium — stigmergy, a shared external record that slowly forgets
The backbone an order–disorder transition — order coupled to transport optimisation by pruning — a mesh condenses, loops are cut, tubes thicken

PARAMETERS EXPLORED

param meaning effect on the image
SA sensor angle — the opening of the three sensors the morphology axis: narrow = smooth isolated veins, wide (≈45–75°) = dense reticular mesh with junctions and loops
RA rotation angle — how sharply an agent can steer steering agility; SA × RA spans the Jones morphology phase diagram
SO sensor offset — how far ahead the agents smell the feature scale: small = fine tangle, large = wide-open cells
depT deposit — the mark left per step stronger deposit = thicker, brighter tubes (stronger positive feedback)
decay the field's forgetting rate — the memory length long memory (low decay) = a bold persistent web; short memory = all but the strongest tubes pruned to threads
diffuse 3×3 mean blend — the trail's blur lets neighbouring tubes merge and fuse (anastomosis); conserves trail mass exactly

Each image below records its exact parameter set.

THE MATHEMATICS the model behind the images

One rule per agent and one field update, run synchronously on a torus. An agent senses three points ahead on the trail field, steers toward the strongest, steps, deposits; the field diffuses and forgets. The picture is the field.

Δθi={0F≥FL,  F≥FR±RA (coin flip)F<FL,  F<FR+RAFL>FR−RAFR>FL\Delta\theta_i = \begin{cases} 0 & F \ge F_L,\; F \ge F_R \\ \pm RA \ \text{(coin flip)} & F < F_L,\; F < F_R \\ +RA & F_L > F_R \\ -RA & F_R > F_L \end{cases}Δθi​=⎩⎨⎧​0±RA (coin flip)+RA−RA​F≥FL​,F≥FR​F<FL​,F<FR​FL​>FR​FR​>FL​​
The three-sensor steering rule: F, F_L, F_R sample the trail at offset SO, straight ahead and at ±SA. Then the agent steps a fixed SS along its heading.
T  ←  (1−λ) [ μ3×3∗(T+d ∑i δxi)]T \;\leftarrow\; (1-\lambda)\,\Big[\, \mu_{3\times 3} * \big( T + d\,{\textstyle\sum_i}\,\delta_{\mathbf{x}_i} \big) \Big]T←(1−λ)[μ3×3​∗(T+d∑i​δxi​​)]
The trail field: every agent deposits d, then a 3×3 mean filter diffuses and the field decays by λ. Positive feedback writes the network; negative feedback prunes it.
T∗=(1−λ) N dλT^{*} = \frac{(1-\lambda)\,N\,d}{\lambda}T∗=λ(1−λ)Nd​
The total trail obeys a linear recurrence and converges to an analytic steady state — the study's measurable truth. Verified to rel. err. 2.16 × 10⁻¹⁶ in Python; the GPU engine lands on the same number (ratio 1.000).
L(t)∼t 0.19L(t) \sim t^{\,0.19}L(t)∼t0.19
The measured coarsening law: the characteristic vein spacing grows as loops are pruned and tubes merge — distinctly slower than the t^{1/3} of Cahn–Hilliard coarsening, a rate specific to agent-trail dynamics.

A visual interpretation of the model, not a claim of scientific precision. The invariants above were verified to machine precision; the morphology phase diagram and the coarsening exponent are empirical measurements of this implementation.

SELECTED STILLS — 4
reticular mesh — the hero web of junctions and loops, chrome-yellow on dark agar
reticular mesh — the hero web of junctions and loops, chrome-yellow on dark agar SA 60° · RA 40° · SO 9 · decay 0.12 · t 150 · plasmodium
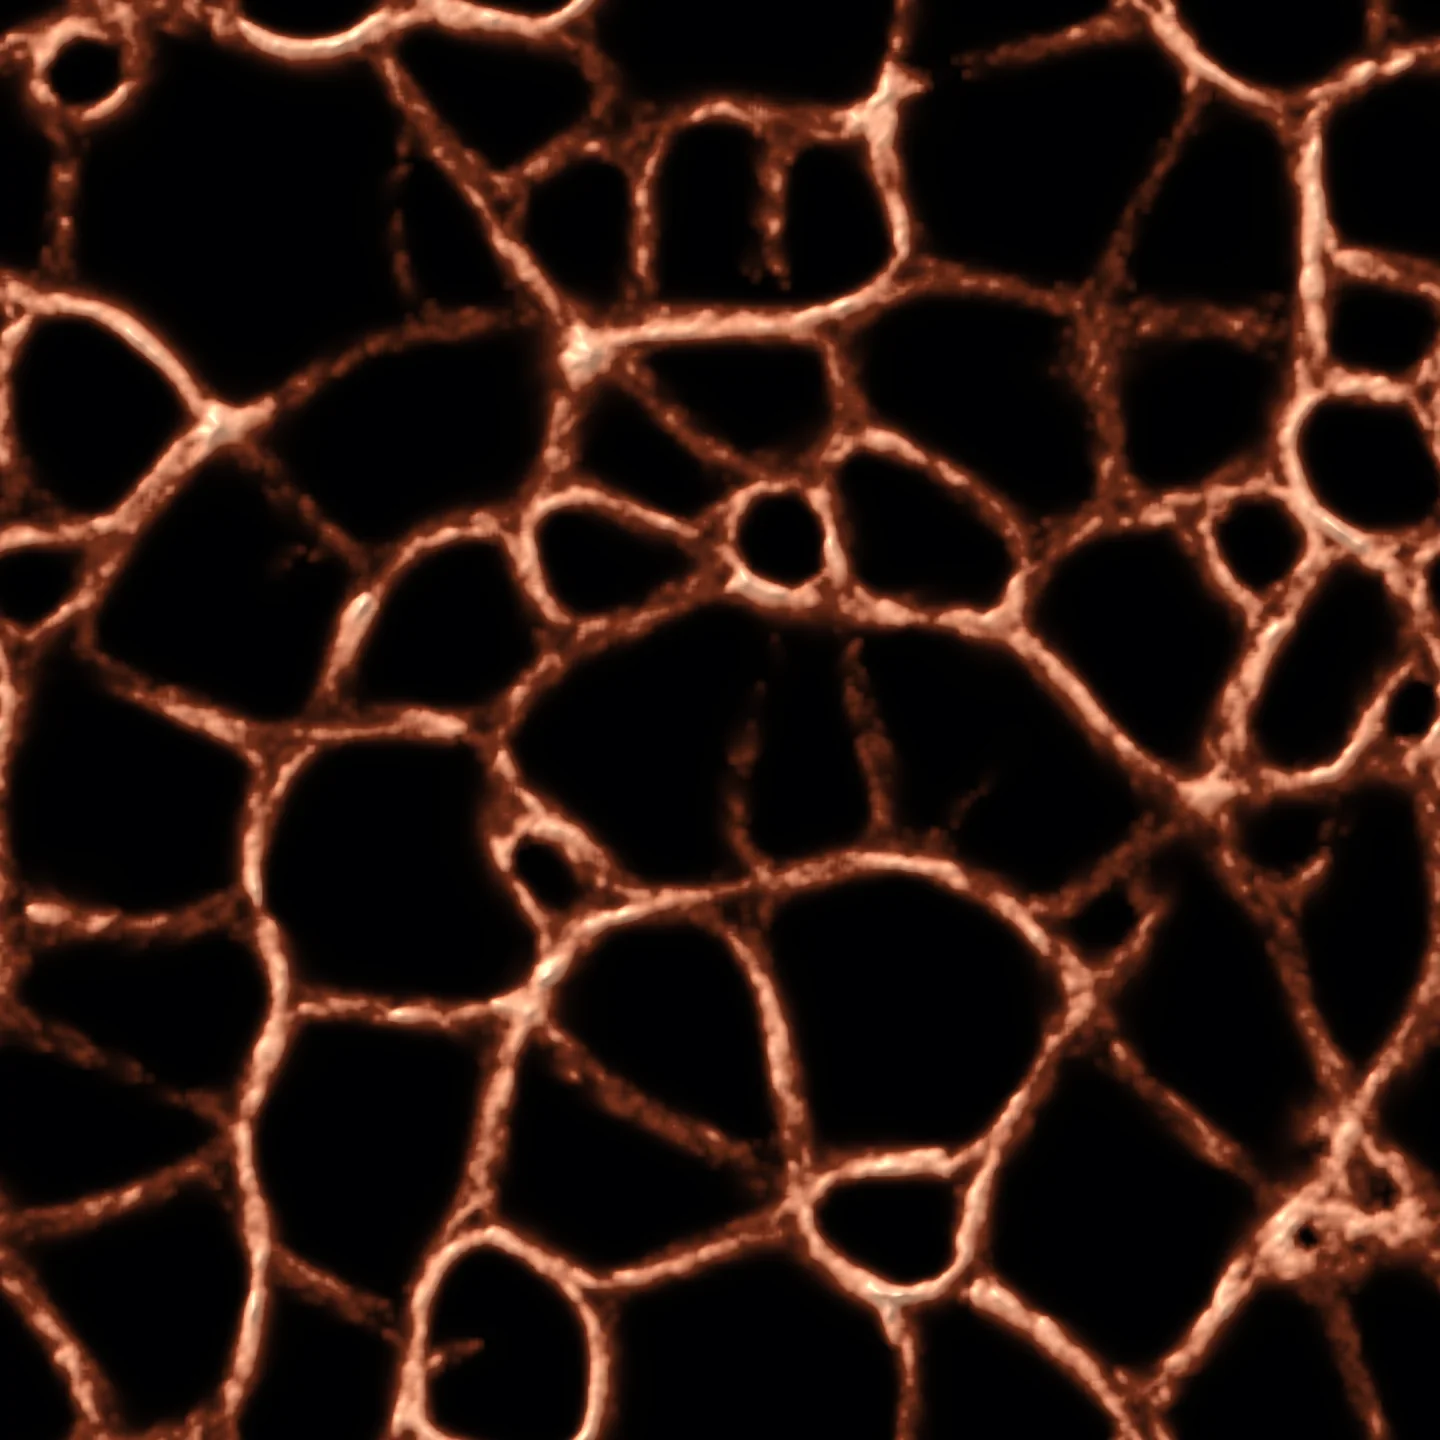
open honeycomb — the network as circulatory system, warm-white vessels on black
open honeycomb — the network as circulatory system, warm-white vessels on black SA 45° · RA 45° · SO 16 · decay 0.24 · t 200 · angiogram
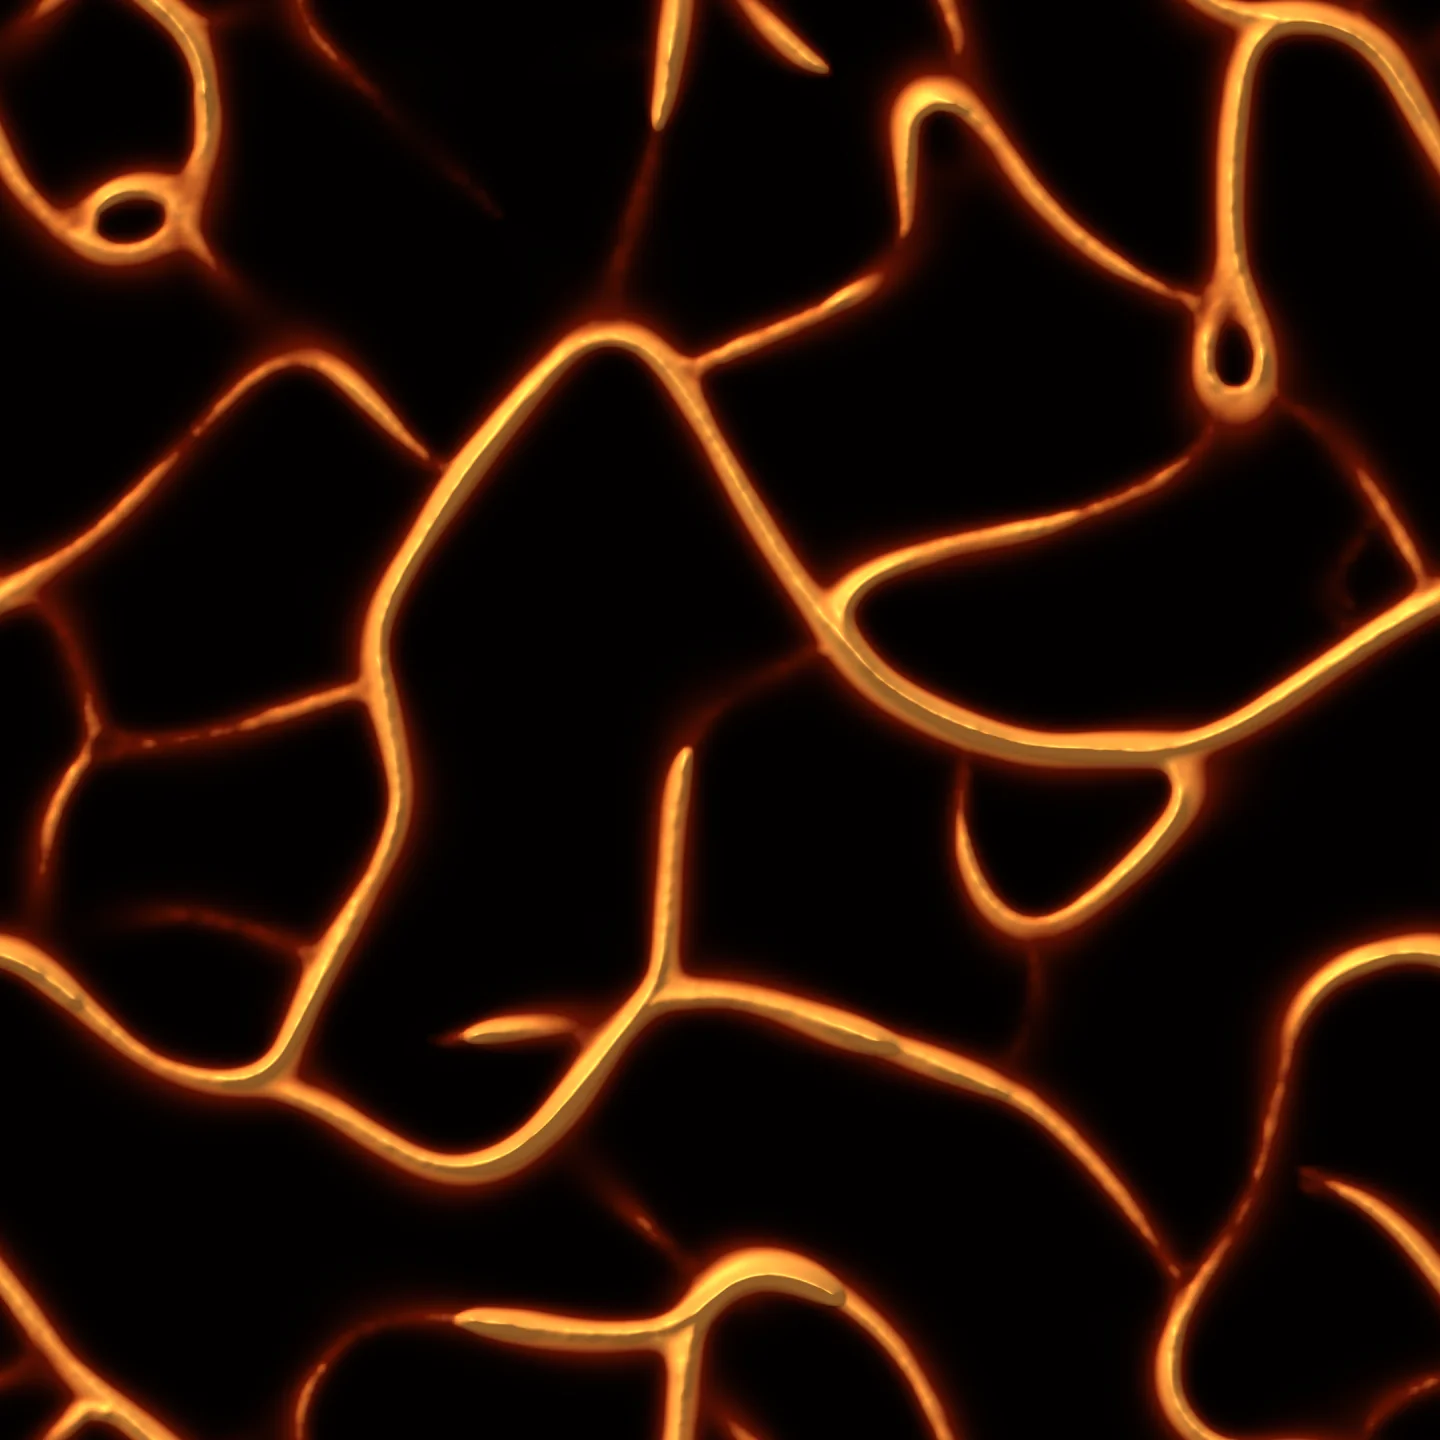
smooth veins — low sensor angle, sparse molten tubes
smooth veins — low sensor angle, sparse molten tubes SA 22.5° · RA 45° · SO 11 · decay 0.09 · t 280 · iron
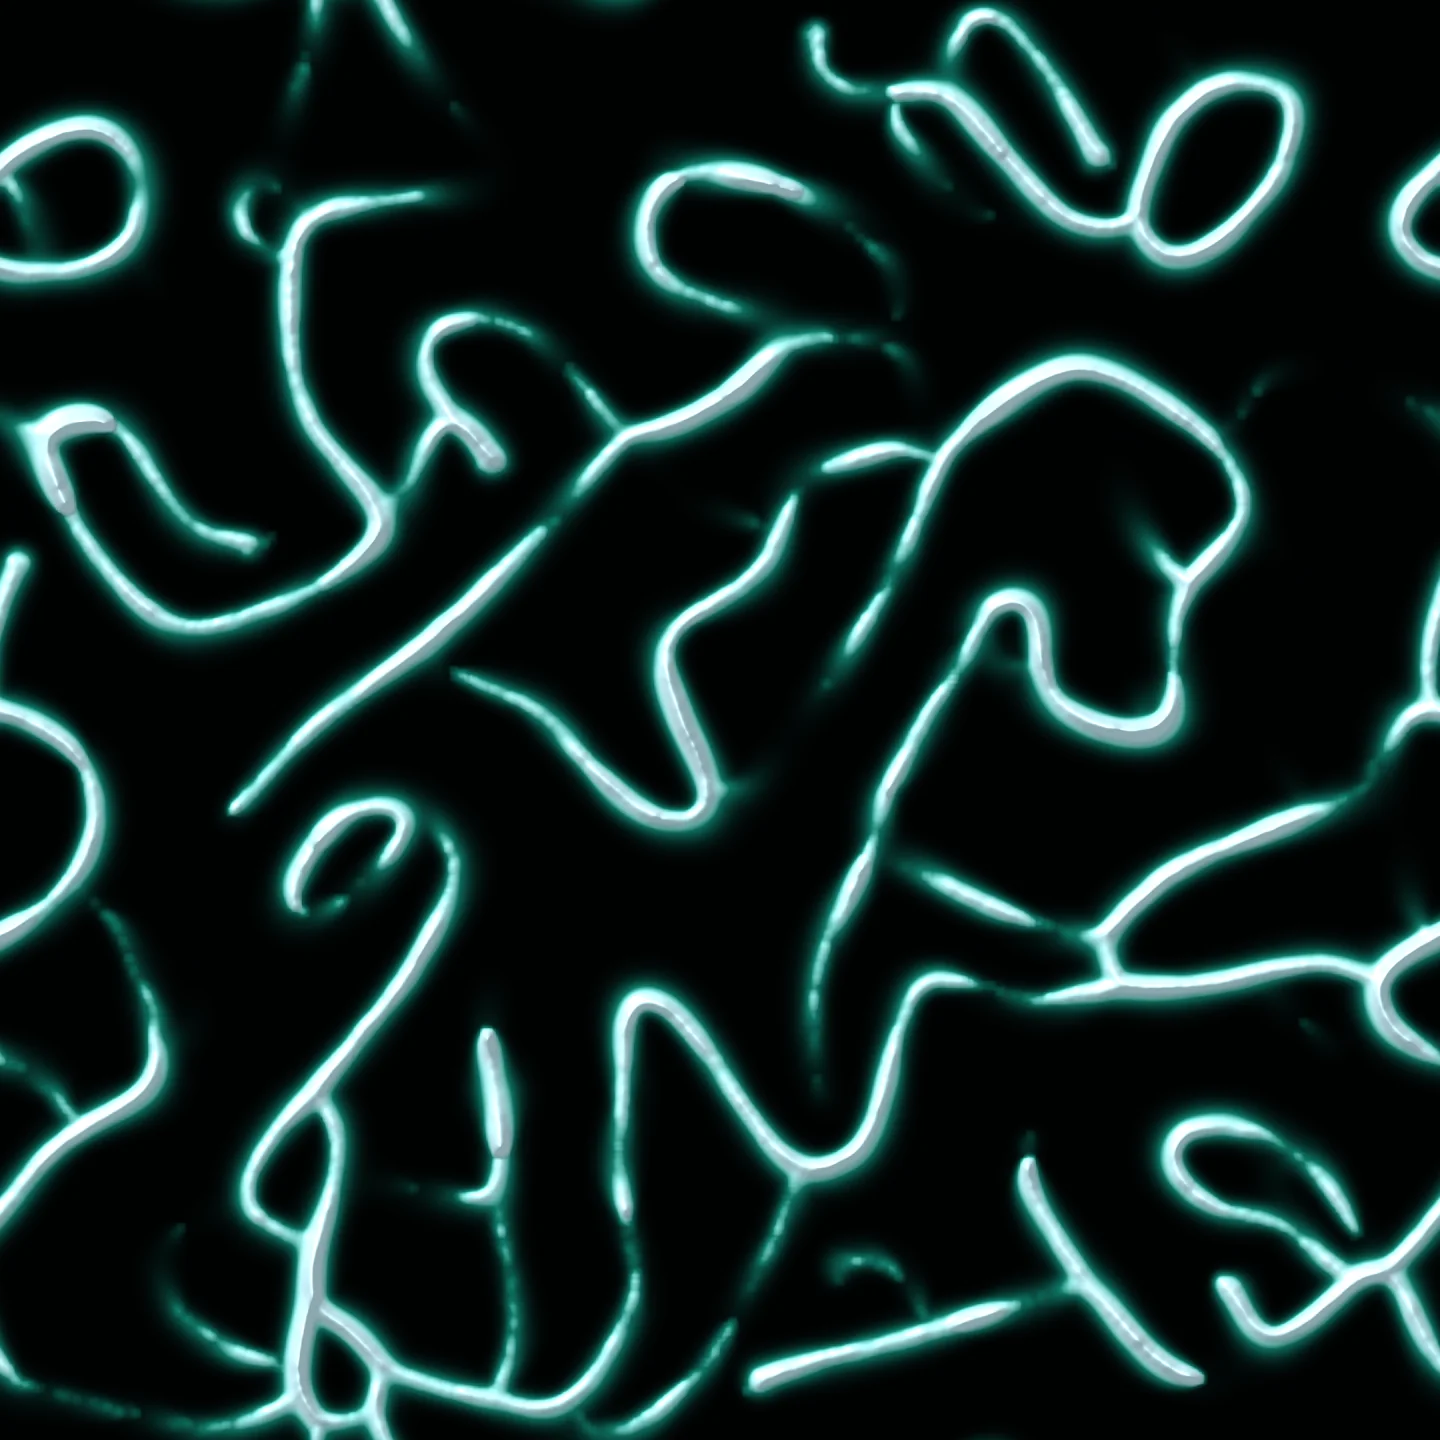
fine tangle — short sensor offset, luminous dendrites in teal
fine tangle — short sensor offset, luminous dendrites in teal SA 45° · RA 45° · SO 5 · decay 0.16 · t 170 · neuron

PROCESS — PARAMETER SWEEPS

The exploration re-runs Jones' morphology mapping from scratch: sensor angle × rotation angle, every cell grown from the same seed to t = 160 and rendered from the trail field. Low SA draws sparse, smooth worm-tubes; high SA condenses the iconic dense reticular mesh; RA sets how nervously the agents track. The vein spacing L, measured per cell from the structure factor, is recorded in the sheet's sidecar — the hero regime (SA 60°, RA 40°) sits in the dense right half.
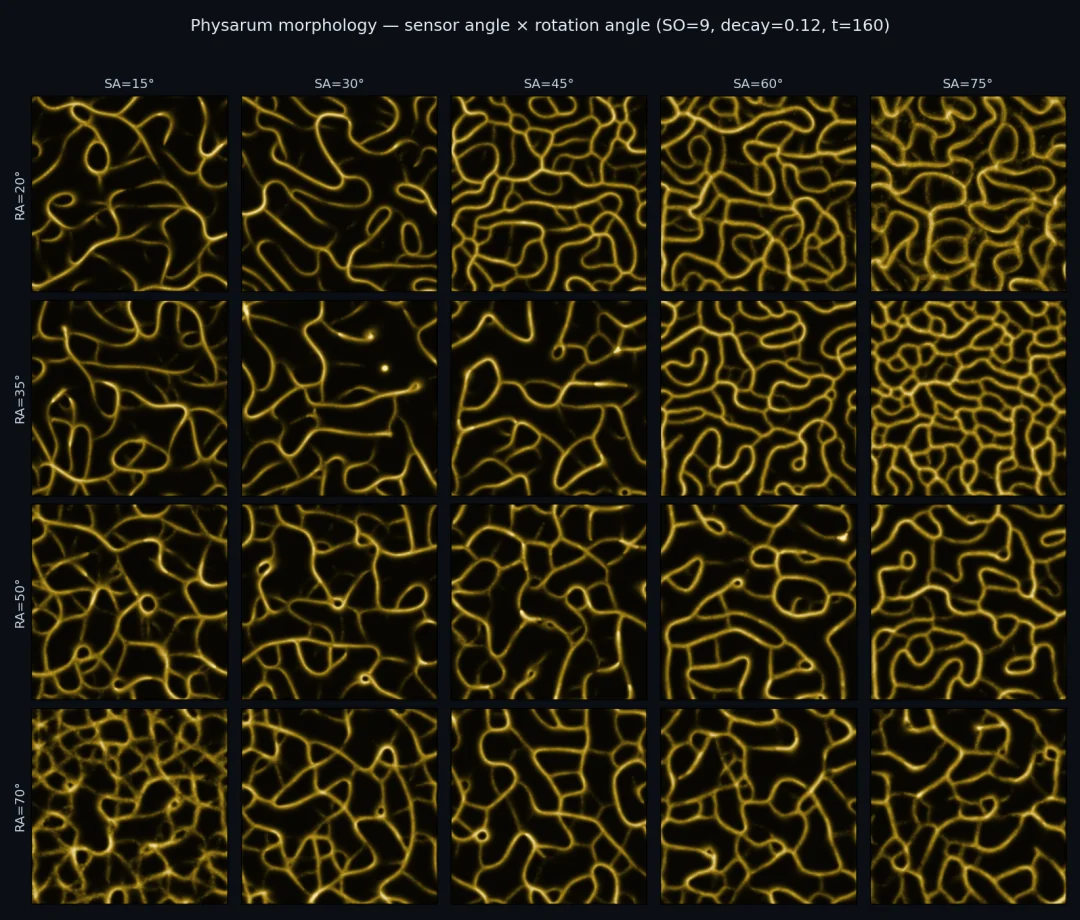
the SA × RA morphology sheet — the Jones phase diagram re-run from scratch
the SA × RA morphology sheet — the Jones phase diagram re-run from scratch SA 15–75° × RA 20–70° · SO 9 · decay 0.12 · t 160 · seed 3 · L per cell in the sidecar

SIGNATURE — OPTIMISED BY FORGETTING

The network is optimised not by growing but by pruning.

Watch the film from the start. A uniform speckle of first deposits condenses, within about forty steps, into a fine mesh — and from then on nothing new is added; the network only reorganises. Weak links starve as diffusion and decay erase them, strong tubes attract more walkers and thicken. The characteristic spacing grows monotonically: measured 26 → 61 px over t = 8 → 1600, a power law close to L ∼ t^0.19 — distinctly slower than the t^1/3 of thermodynamic coarsening. The mould's optimisation has its own clock.

So the screen's porosity is a clock hand: how coarse the mesh is reads the time since the noise. And the move is the one the living organism uses — with food sources added, pruning the redundant links is exactly what leaves the shortest path through a maze (Nakagaki 2000) and the near-optimal rail-map webs (Tero 2010). Here there is no food at all. The pruning runs anyway, selecting a network out of nothing but noise and forgetting.

COLOUR = THE MICROSCOPY, NOT THE ORGANISM

The trail field is the chemo-attractant concentration, so brightness reads as roughly the flow a tube would carry — thick bright veins are the busy trunks, faint threads the branches being pruned. The hero palette, plasmodium, is grounded in the living organism: chrome-yellow tubes on dark agar, the colour of real Physarum polycephalum.

The alternate palettes read the same model under different microscopy — angiogram (warm-white vessels on black), neuron (fluorescent dendrites), iron (molten tubes). Colour is the imaging, not the organism. The one measured fact carried into every frame is the coarsening itself: vein spacing grows as loops are pruned, so the palette never needs to say what the porosity already does.

the same rule under fluorescence — the neuron palette's luminous dendrites
the same rule under fluorescence — the neuron palette's luminous dendrites SA 45° · RA 45° · SO 5 · decay 0.16 · neuron

These are artistic approximations of the organism's appearance, not measurements.

REFERENCES

  1. Jeff Jones. "Characteristics of Pattern Formation and Evolution in Approximations of Physarum Transport Networks." Artificial Life, vol.16, no.2, 127-153 (2010).
  2. Toshiyuki Nakagaki, Hiroyasu Yamada, Ágota Tóth. "Maze-Solving by an Amoeboid Organism." Nature, vol.407, 470 (2000).
  3. Atsushi Tero, Seiji Takagi, Tetsu Saigusa, Kentaro Ito, Dan P. Bebber, Mark D. Fricker, Kenji Yumiki, Ryo Kobayashi, Toshiyuki Nakagaki. "Rules for Biologically Inspired Adaptive Network Design." Science, vol.327, no.5964, 439-442 (2010).

INTERACTIVE STUDY

Thousands of agents walk a shared trail field: each one smells three points ahead, turns toward the strongest trail, steps, and leaves a mark — and the field slowly forgets. Watch a network condense out of noise, then coarsen as loops are pruned. Decay is live and is the one dial to feel: the medium’s memory. Drag it down and the veins thicken into a bold stable web; drag it up and all but the strongest tubes are pruned to threads. It is a deliberately simplified instrument, capped in resolution with a few curated knobs and no export, separate from the full engine used to author the finished works.

SIMPLIFIED INSTRUMENTPHYSARUM · JONES 2010 · DECAY LIVE

This interactive study is not intended as a scientifically validated reproduction. It is a visual interpretation generated from an implemented model and curated parameter exploration — and it is a deliberately simplified instrument, separate from the full engine used to author the finished works.

← ALL STUDIES STUDY #25 · KELVIN–HELMHOLTZ INSTABILITY · IN OBSERVATION →
PHENOMENA STUDIES — WEAVER AXIOM PERSONAL VISUAL RESEARCH · © 2026