STUDY #30 · 2026 · IN OBSERVATION
Abelian Sandpile — Self-Organized Criticality
A model-driven visual study of a pile that finds its own breaking point.
WHAT IS THIS
Bak, Tang and Wiesenfeld asked in 1987 why so much of nature produces events of every size: earthquakes, solar flares, avalanches, the crackle of 1/f noise. Their answer was a pile of sand. Add grains slowly and the pile steepens until it reaches the angle where the next grain can start a slide of any size — and then it stays there, without anyone tuning it. They called this self-organized criticality: a system that walks to its own critical point.
The lattice version is the entire model. Each cell holds an integer 0–3. Add a grain; if a cell reaches 4 it topples, keeping nothing and giving one grain to each of its four neighbours; grains that leave the edge are lost. Toppling can set off neighbours, and the chain runs until every cell is stable again. That chain is the avalanche.
Two things make this study possible. First, Dhar proved in 1990 that the result of a collapse — both the final heights and the number of topplings at every cell — is completely independent of the order in which cells are toppled. Second, that theorem is exactly the licence a GPU needs: topple every unstable cell at once is one of the legal orders, so the shader can be checked against the reference simulation bitwise, with no tolerance at all.
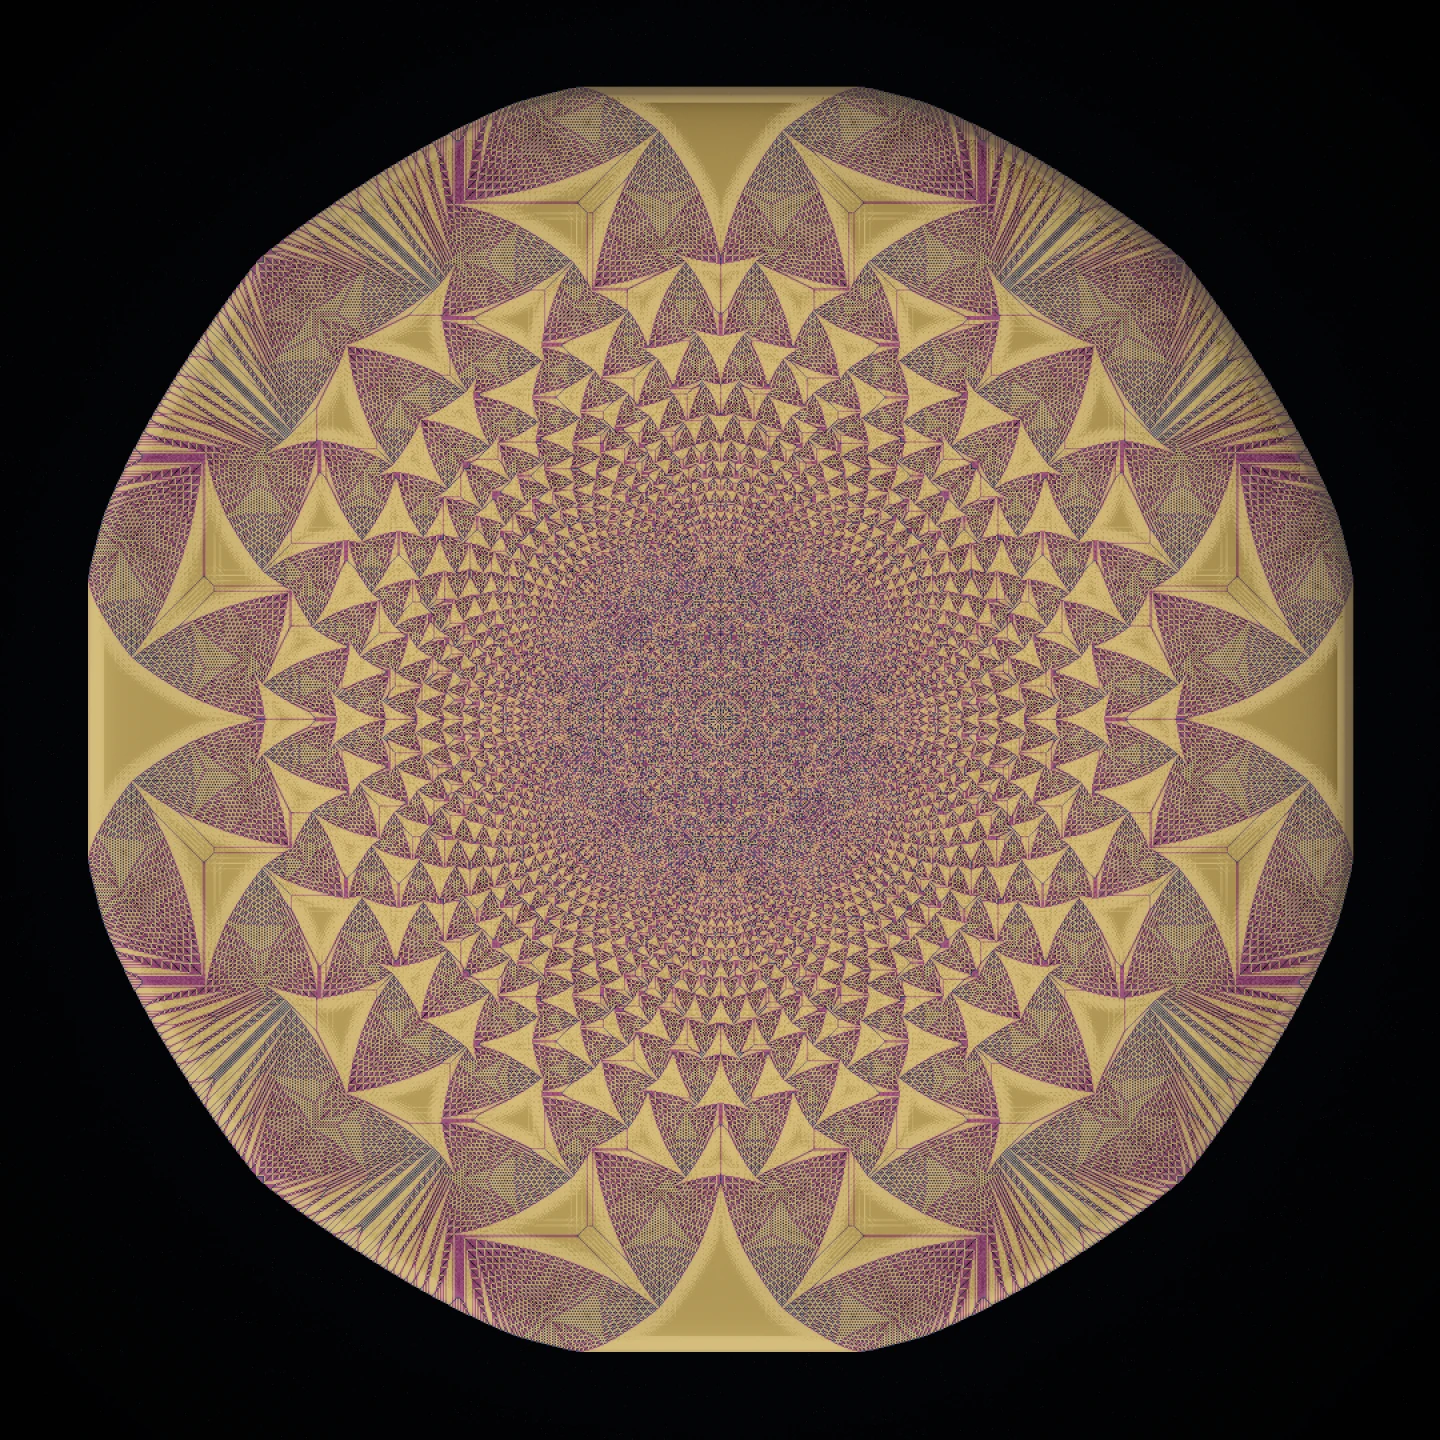
This is not a scientific simulation result, but a visual interpretation of the phenomenon.
AFTER THE THRESHOLD, THE EDGE THAT SETS ITSELF
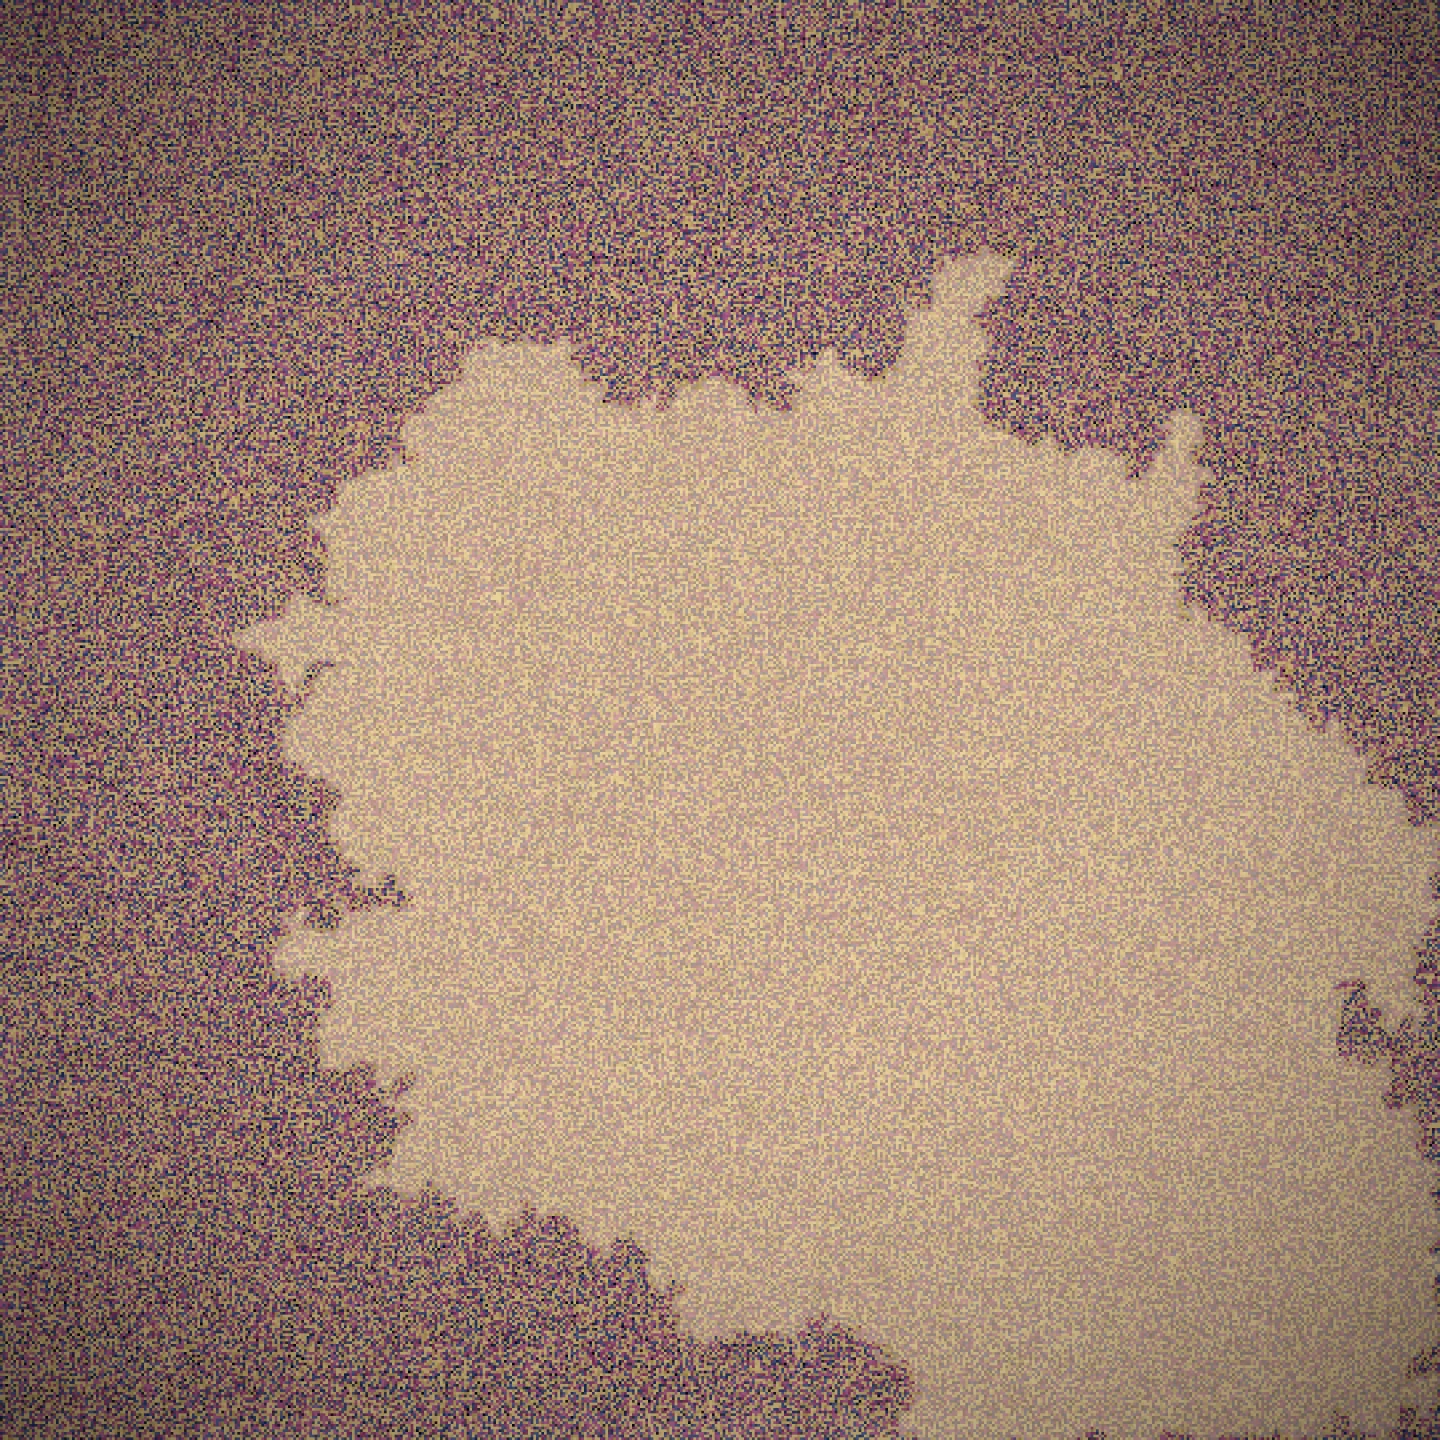
Percolation is tuned to its critical point. The sandpile walks there.
PARAMETERS EXPLORED
Each image below records its exact parameter set.
THE MATHEMATICS the model behind the images
One integer rule, no parameters. A cell that reaches four grains gives one to each neighbour; the theorems below are why the pictures can be checked exactly, with no tolerance at all.
A visual interpretation of the model, not a claim of scientific precision. The checks are integer-exact where the theory is (order independence, recurrent counts, conservation) and statistical where it is not (stationary heights, avalanche exponents on finite lattices).
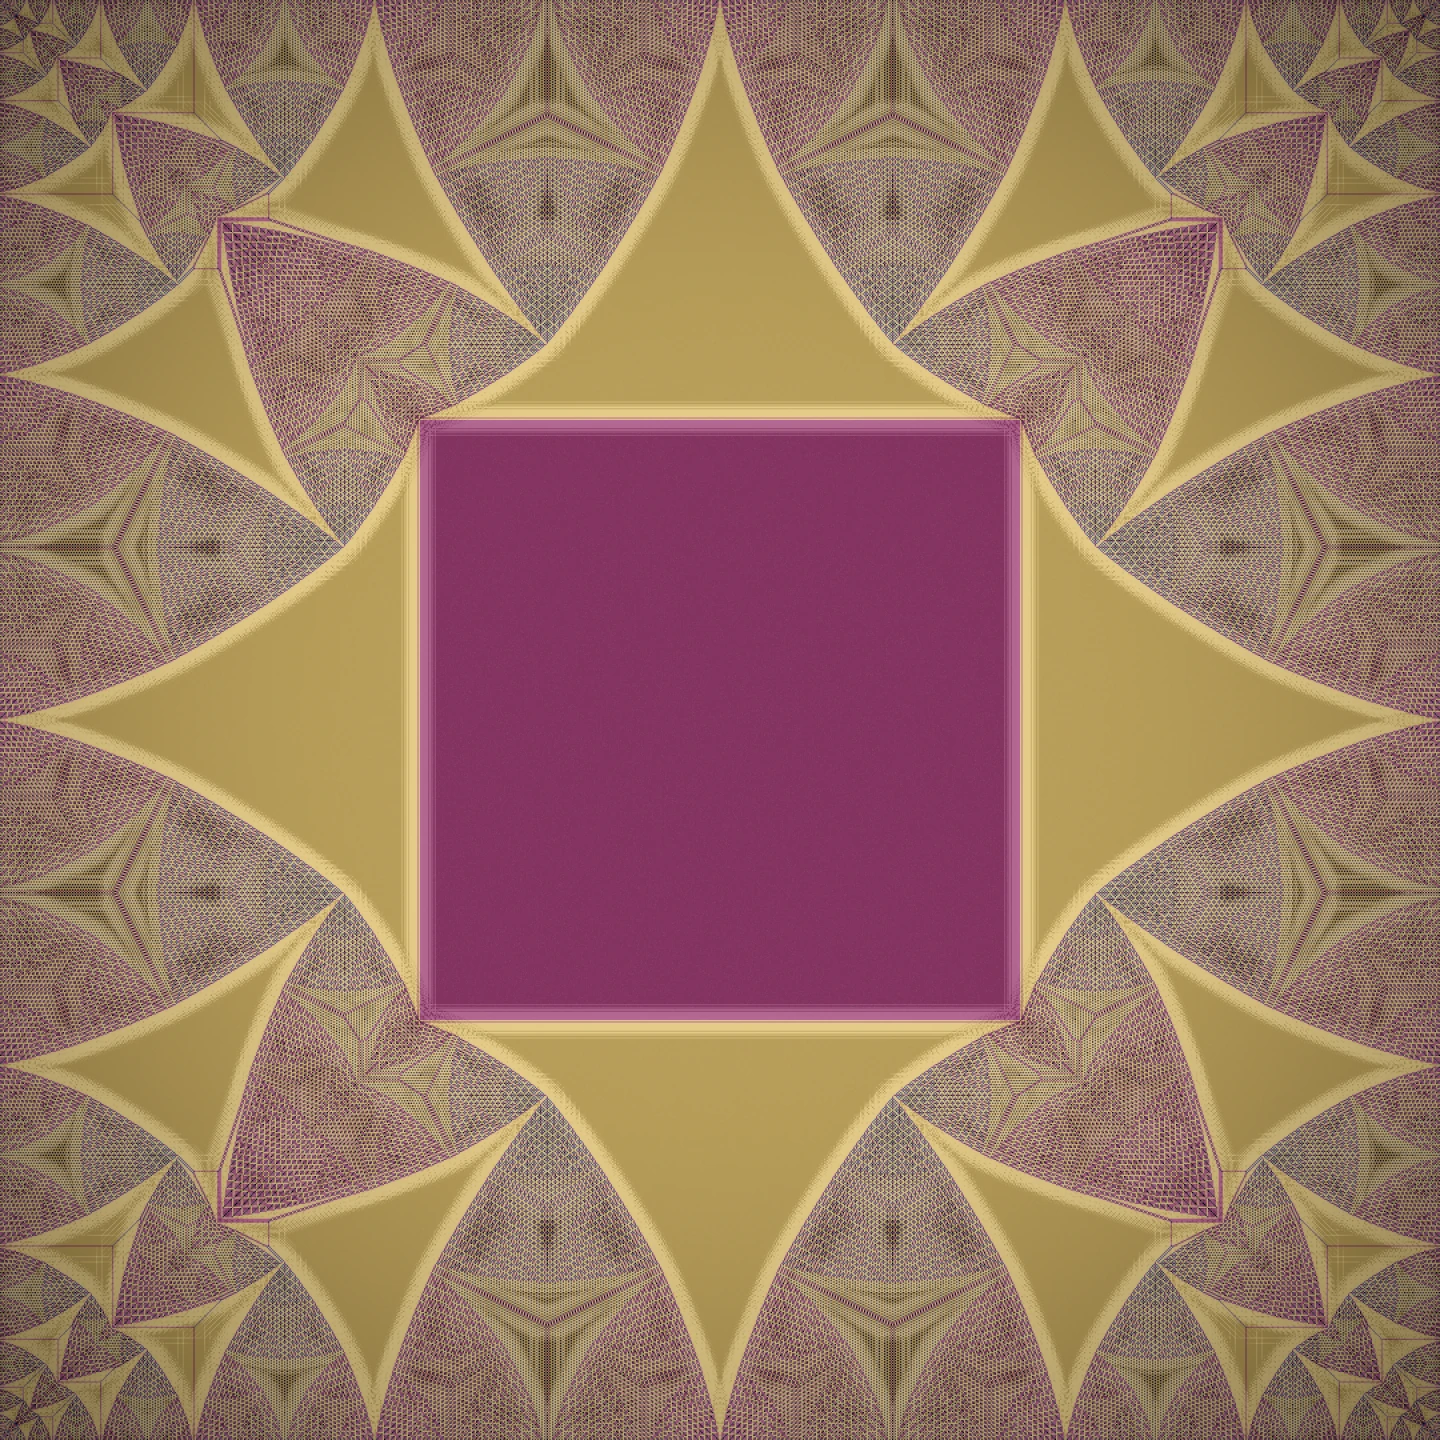
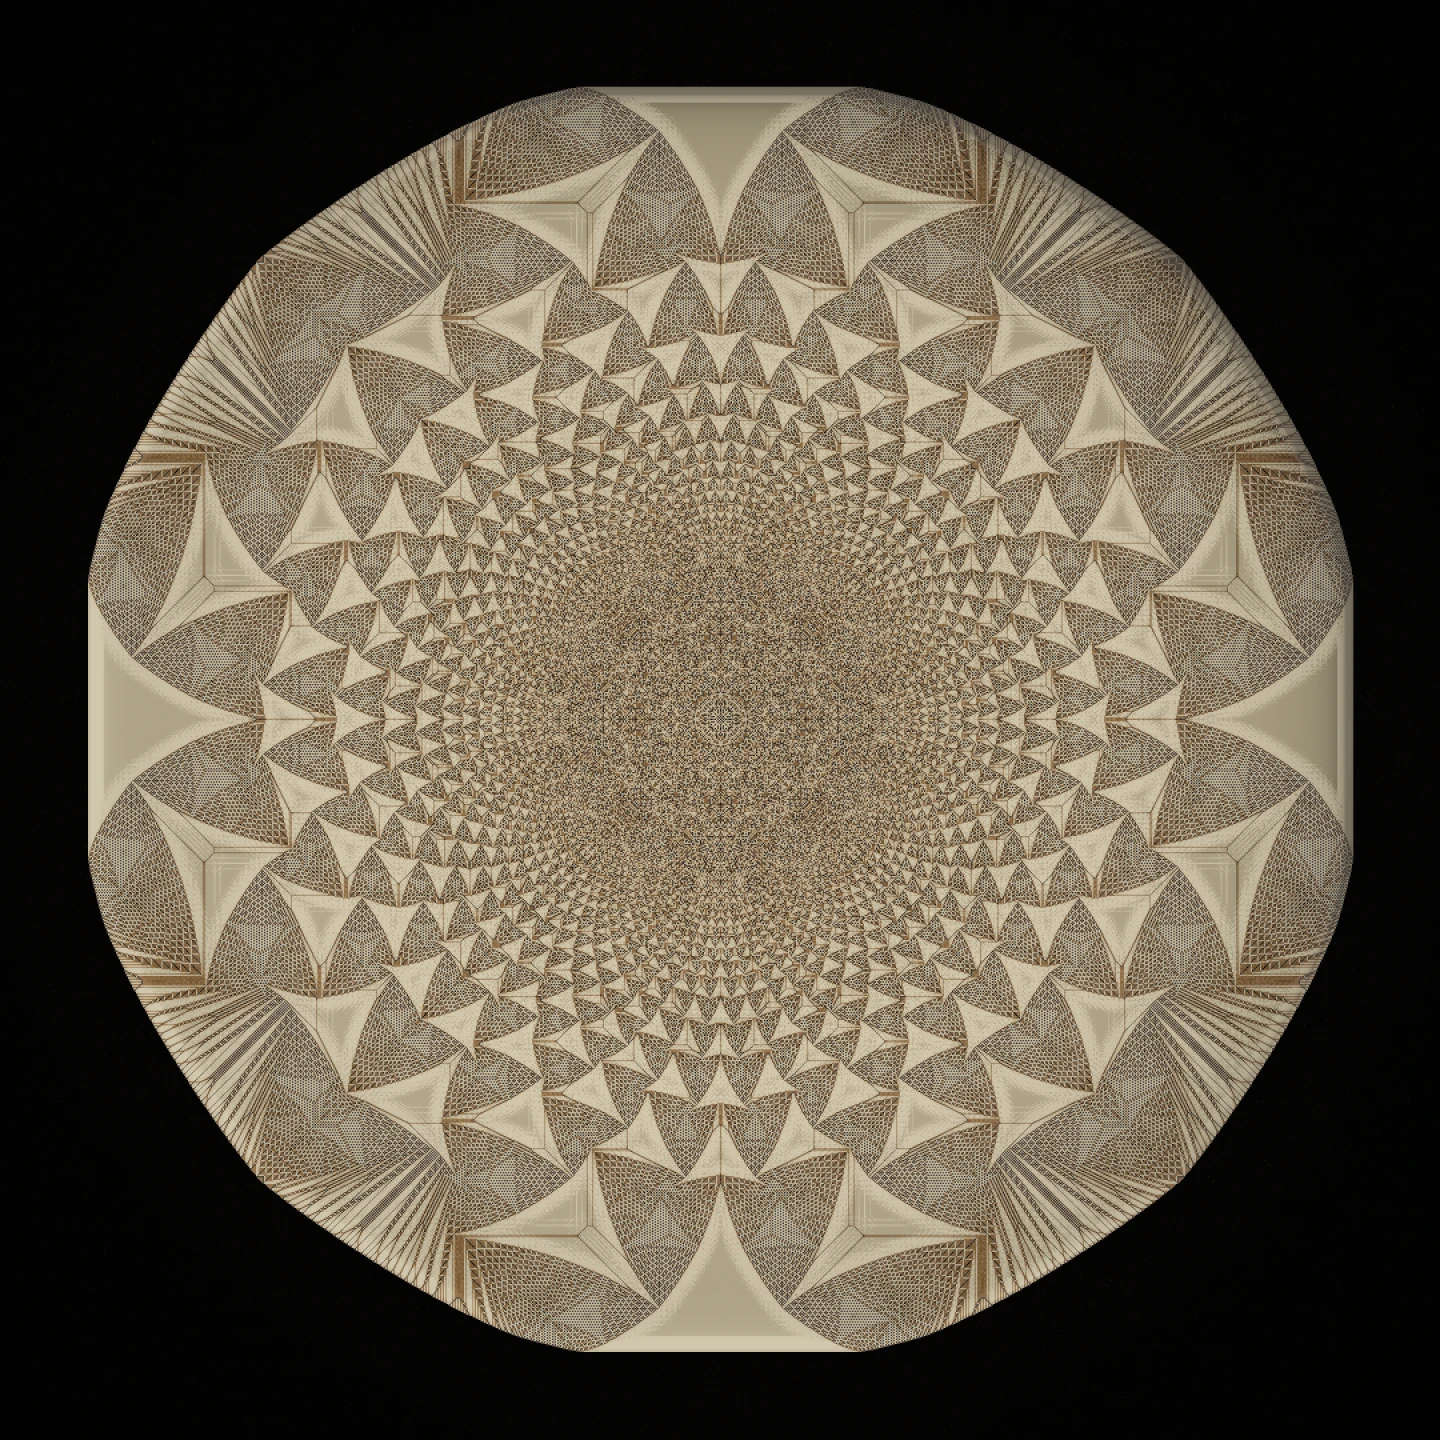
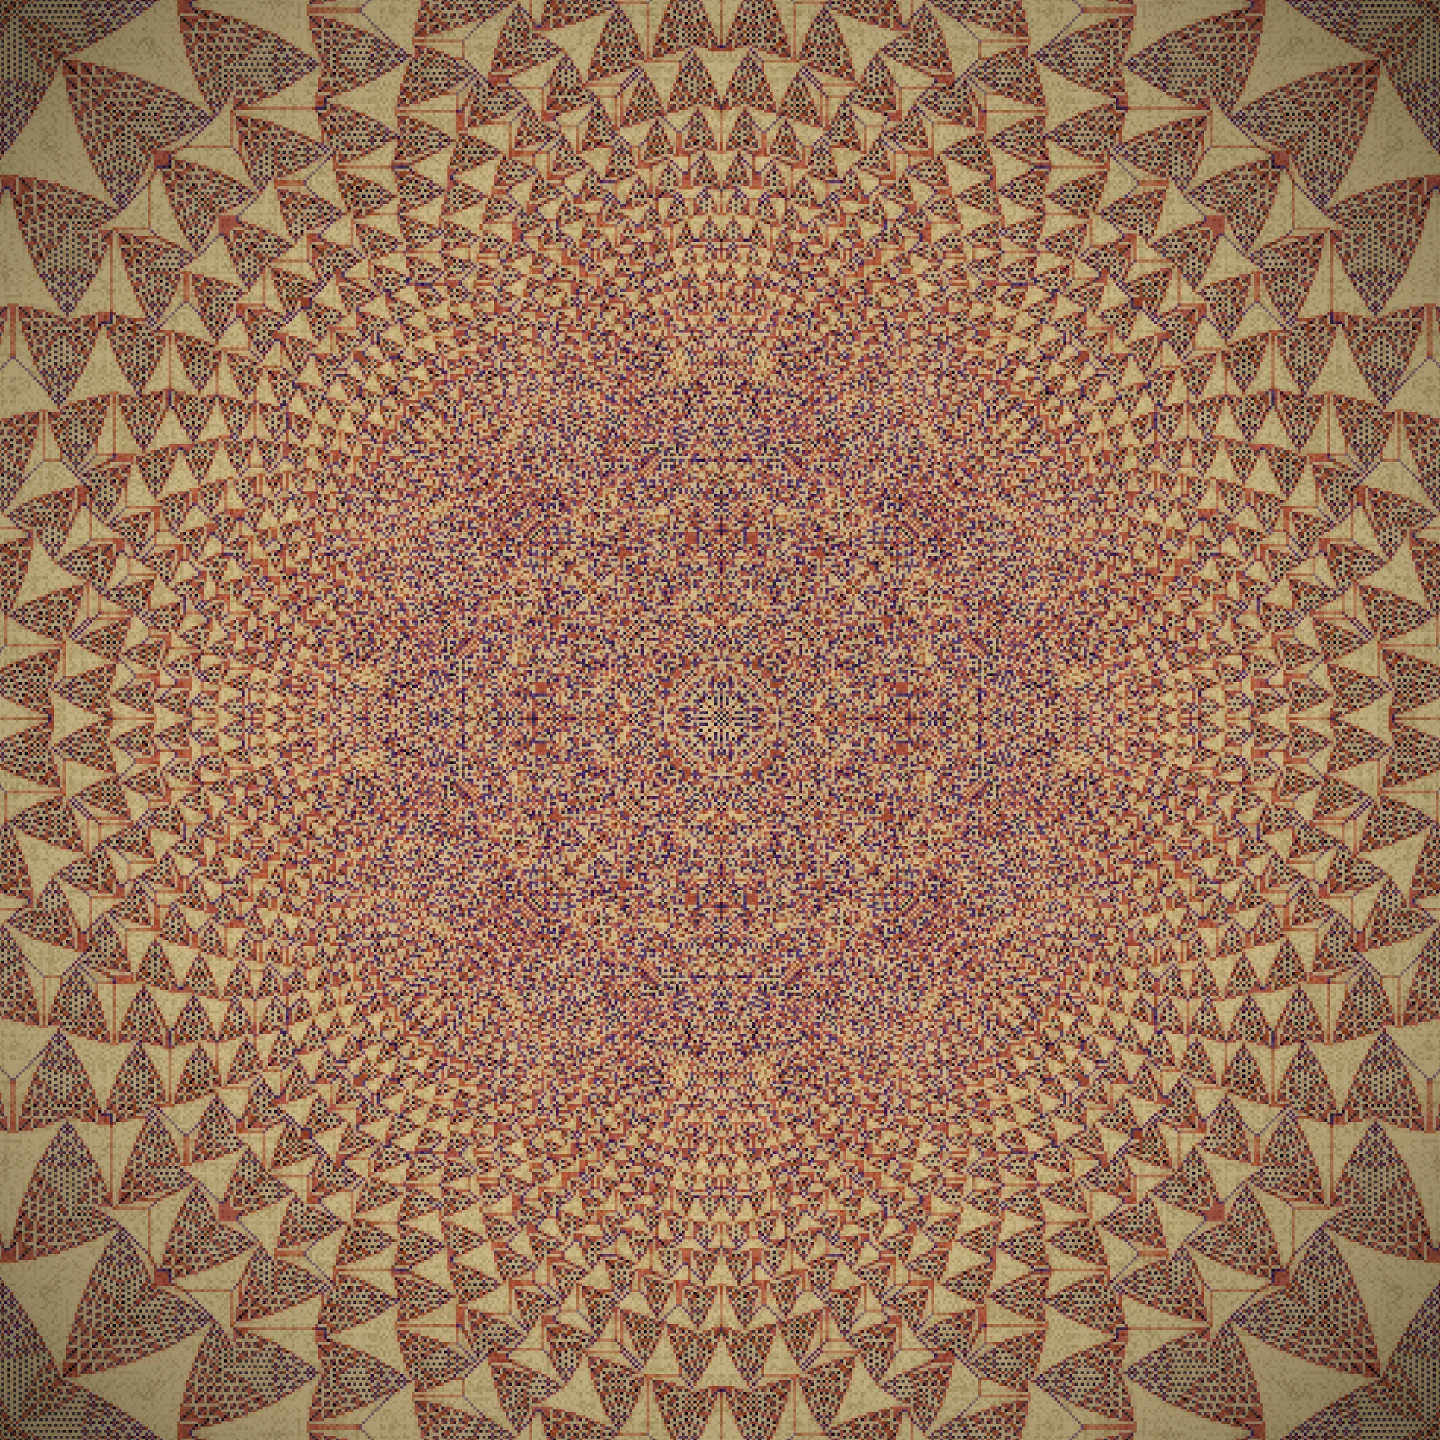
SELECTED STILLS — 7
PROCESS — PARAMETER SWEEPS
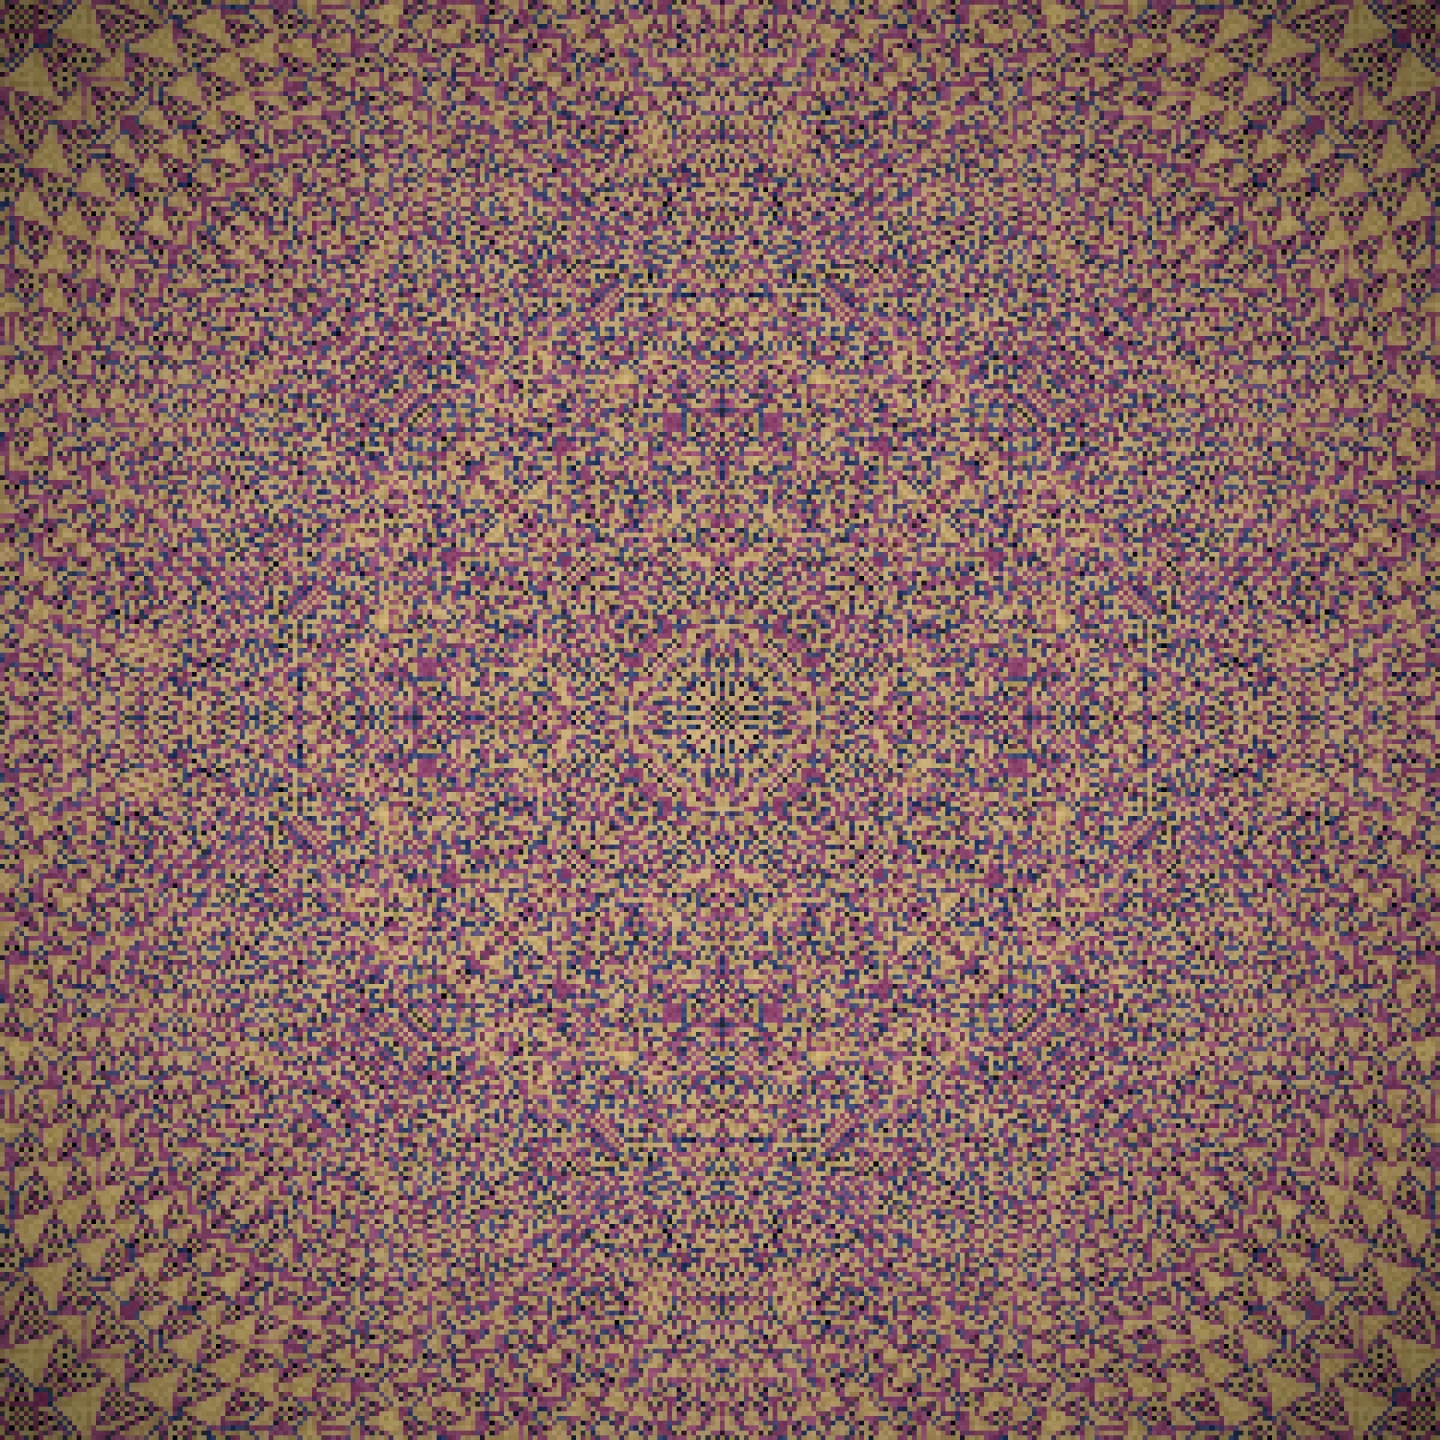
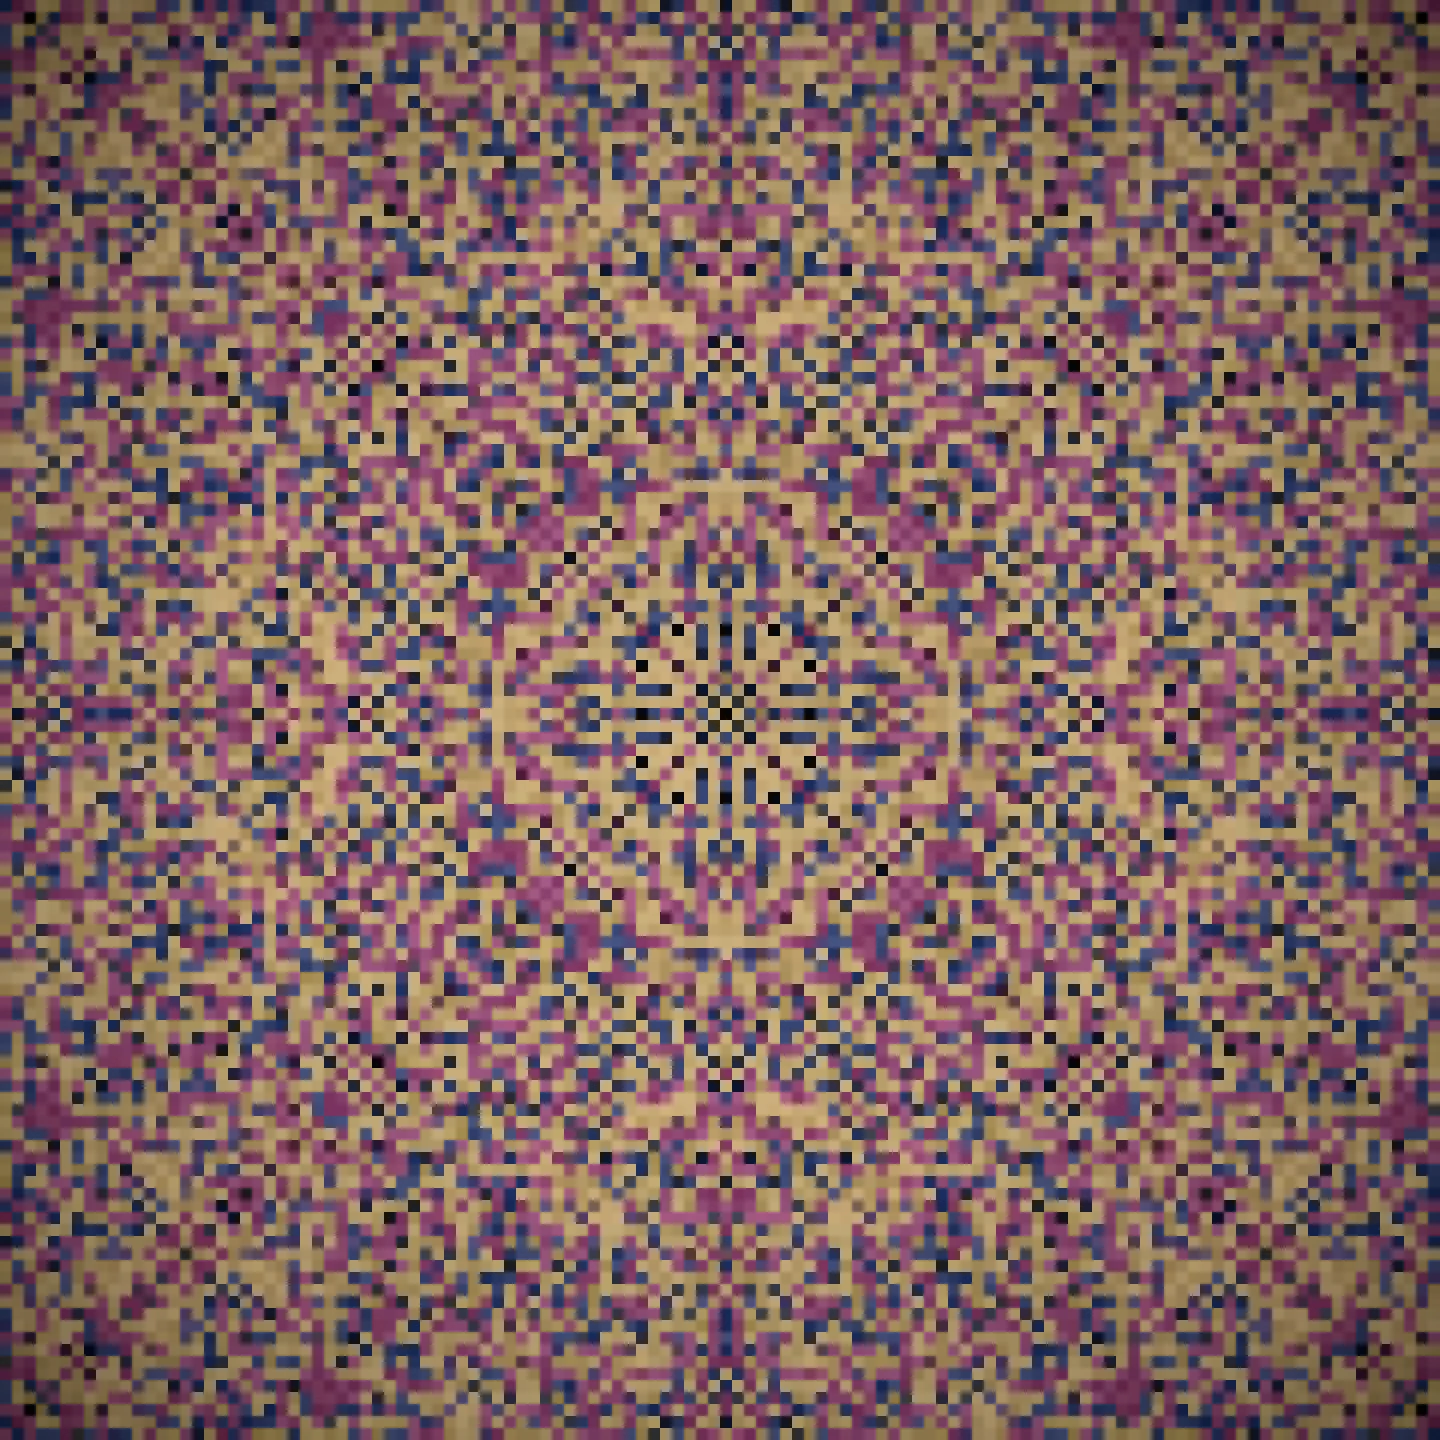
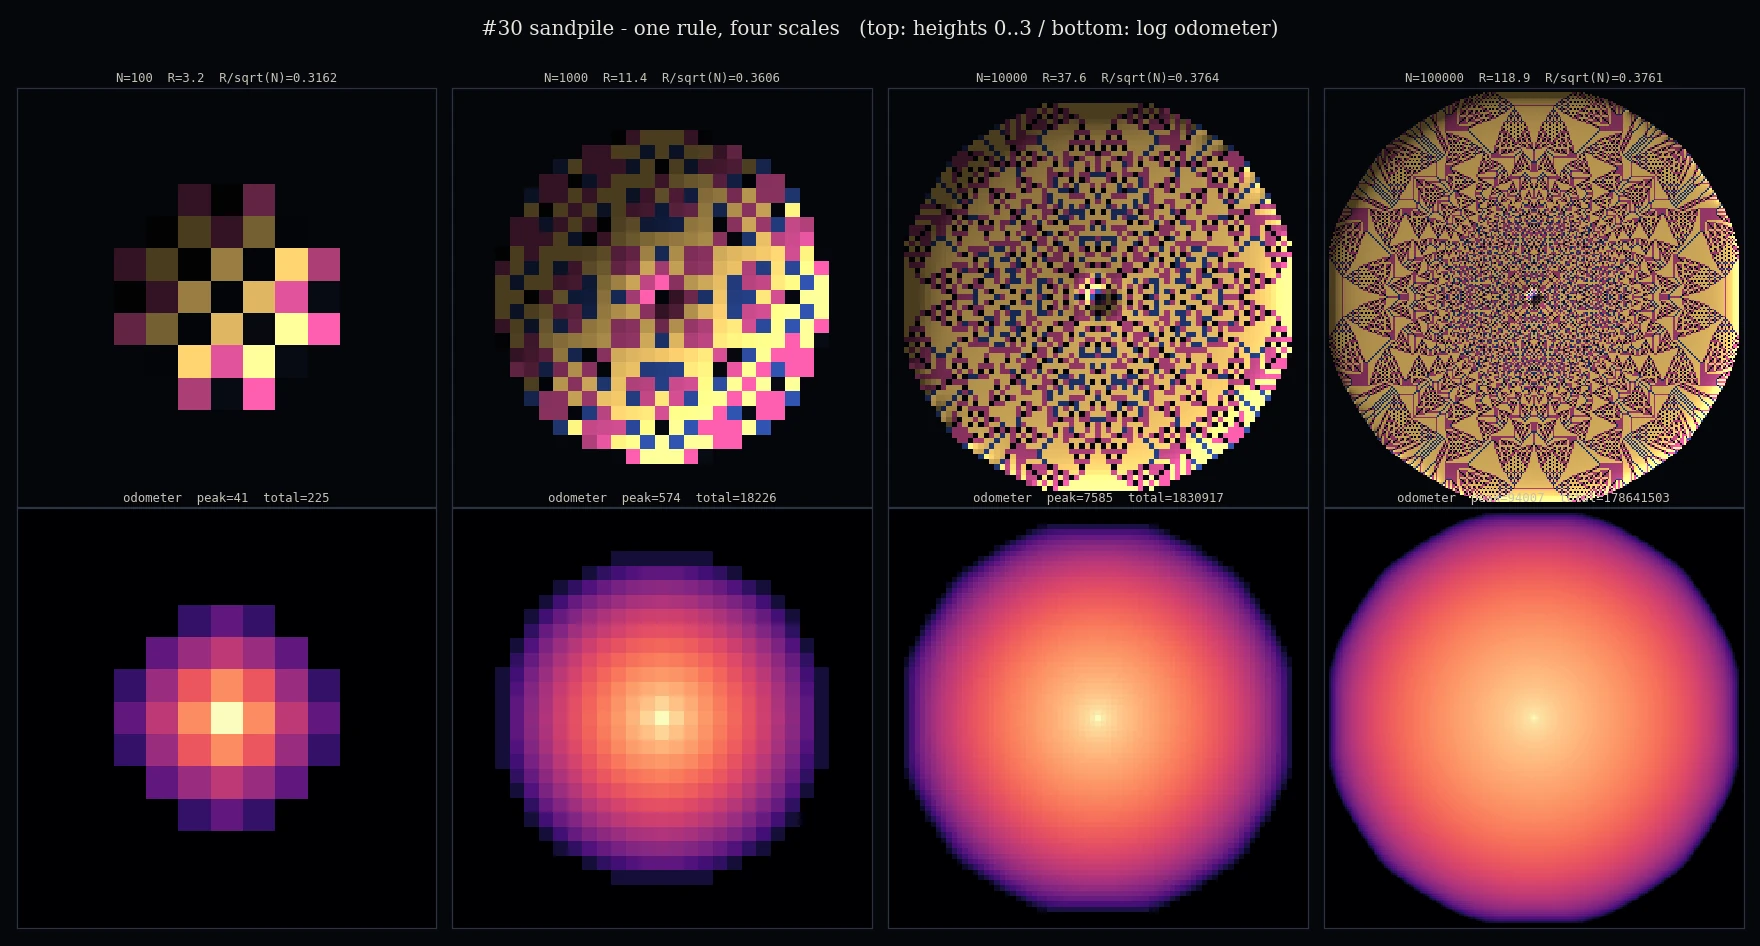
The scale ladder — the same single point fed 10², 10³, 10⁴, 10⁵ grains (heights above, log odometer below). The measured radius keeps the ratio R/√N pinned at 0.3162 → 0.3606 → 0.37643 → 0.37609: the pattern is one fixed shape blown up, each ×4 in grains adding one generation to the hierarchy of triangles while total toppling work grows as N². The finished plate is this ladder continued to 1.7 million.
SIGNATURE — THE PILE MEASURES ITSELF
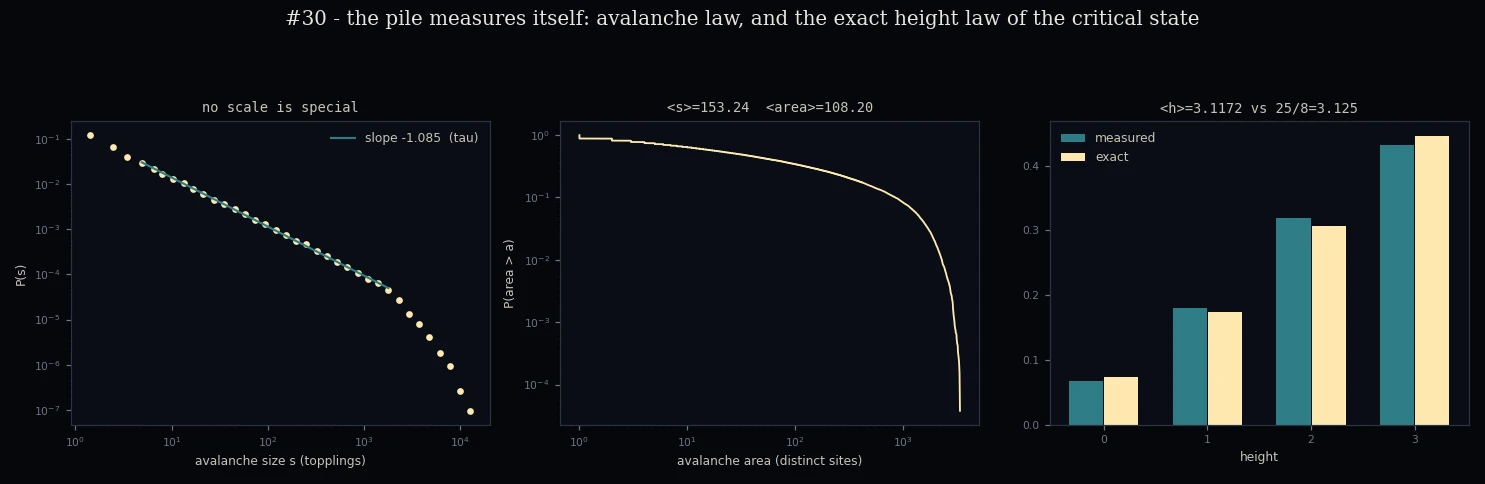
No scale is special — every collapse lands on the same straight line.
Rain single grains on the settled pile and record how many cells each one knocks over. Most do nothing; some topple a handful; rarely one takes a quarter of the plate. On log-log axes the sizes fall on a straight line across four decades (measured slope τ ≈ −1.085 at L = 64) — the power law that is the whole claim of self-organized criticality, reached here without tuning a single parameter. The state it hovers in is exactly known: the mean height converges on 25/8 (measured 3.13172) and the chance of the lowest height on 2/π² − 4/π³ (measured to 0.37%).
The strangest identity is the quietest: the average number of times each cell topples after one added grain equals the lattice Green function — the expected visits of a simple random walk before it leaves the grid (matched to 0.05%, its whole spatial profile to 0.02%). A rule with no randomness in it averages out to pure diffusion; the mean avalanche is the shadow of a random walk. And the two ways of building a pile do not build the same pile: grains stacked on one point pack the interior to density 2.25, while the rained-on critical state holds only 17/8 = 2.125 — the mandala is denser than the weather.
COLOUR = PHOTOELASTIC FRINGES
Stress inside a real granular pile is not invisible: press photoelastic discs between crossed polarisers and the force chains light up as bright fringes on a dark ground. The fringes do not simply go from dark to light — they walk an order of colours. The reference palette, photoelastic, takes its four steps (near-black → deep blue → magenta → gold) from that fringe order and assigns them to the four heights a cell can hold: gold is a cell one grain away from collapse.
The variations are not moods; each is a place where the same power law was actually reported. rice — the Oslo rice pile, the laboratory experiment where avalanche statistics of this kind were measured directly. seismic — the Gutenberg-Richter law for earthquake magnitudes. solar — the energy distribution of solar flares in EUV false colour. neural — bursts in cortical tissue under calcium imaging. Same pile, different instrument.
The colours are artistic approximations of those imaging conventions, not measured values.
REFERENCES
- Per Bak, Chao Tang, Kurt Wiesenfeld. "Self-organized criticality: An explanation of the 1/f noise." Physical Review Letters, vol.59, no.4, 381-384 (1987).
- Deepak Dhar. "Self-organized critical state of sandpile automaton models." Physical Review Letters, vol.64, no.14, 1613-1616 (1990).
- Satya N. Majumdar, Deepak Dhar. "Height correlations in the Abelian sandpile model." Journal of Physics A: Mathematical and General, vol.24, no.7, L357-L362 (1991).
- V. B. Priezzhev. "Structure of two-dimensional sandpile. I. Height probabilities." Journal of Statistical Physics, vol.74, no.5-6, 955-979 (1994).
- Wesley Pegden, Charles K. Smart. "Convergence of the Abelian sandpile." Duke Mathematical Journal, vol.162, no.4, 627-642 (2013).
- Lionel Levine, Wesley Pegden, Charles K. Smart. "Apollonian structure in the Abelian sandpile." Geometric and Functional Analysis, vol.26, no.1, 306-336 (2016).
- Vidar Frette, Kim Christensen, Anders Malthe-Sørenssen, Jens Feder, Torstein Jøssang, Paul Meakin. "Avalanche dynamics in a pile of rice." Nature, vol.379, 49-52 (1996).
INTERACTIVE STUDY
Drop grains on a grid. A cell holding four grains topples and gives one to each neighbour; grains that fall off the rim are gone. There is no dial for “critical” anywhere in that rule — yet the pile walks to a state where one more grain can trigger a collapse of any size. The meter below the plate keeps the size of every collapse: no matter how you pour, the histogram is a straight line on log–log. Click the lattice to pour there. It is a deliberately simplified instrument, capped at a 192² lattice with a few curated knobs and no export, separate from the full engine used to author the finished works.
This interactive study is not intended as a scientifically validated reproduction. It is a visual interpretation generated from an implemented model and curated parameter exploration — and it is a deliberately simplified instrument, separate from the full engine used to author the finished works.